
Open a Free Demat Account !
₹0 AMC & Account Opening Fee
Is National Stock Exchange of India IPO Good or Bad – Detailed Review

 Last Updated: 17 September, 2026
 11 min read




00:00 / 00:00


Summary
| ||
National Stock Exchange of India’s IPO is set to open its initial public offering from September 17, 2026, to September 21, 2026. When considering applying for this IPO, potential investors will want to understand whether the National Stock Exchange of India IPO is a good investment and if it is worth subscribing to.
This article provides a comprehensive analysis of the National Stock Exchange of India IPO, covering its business operations and a fundamental analysis of its RHP to help you make an informed investment decision.
Investments in the securities market are subject to market risks. Read all the related documents carefully before investing.

National Stock Exchange of India IPO Review
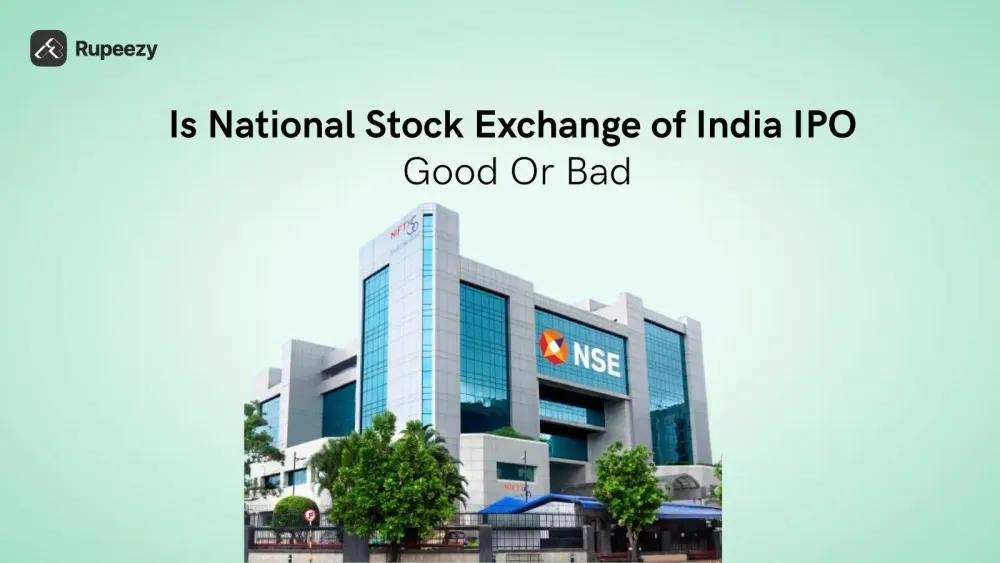
National Stock Exchange of India Limited was incorporated in 1992 and commenced operations in 1994, revolutionizing India’s financial architecture by pioneering countrywide, screen-based automated trading.
Headquartered at the Bandra Kurla Complex (BKC) in Mumbai, Maharashtra, the exchange serves as the cornerstone of India’s economic growth and capital formation.
NSE is set to debut its equity shares exclusively on BSE on September 24, in accordance with SEBI's regulatory framework for market infrastructure institutions.
The company operates across core integrated business revenue segments (as per FY26 revenue):
Trading Services Segment (Transaction Charges): 78.65%
Data Connectivity Charges: 6.80%
Other Operating Revenue / Treasury Income on Margins: 5.07%
Data Feed & Terminal Services: 2.83%
Listing Services: 2.12%
Clearing & Settlement Services: 1.51%
Data Centre Rack Charges / Colocation: 1.24%
Index Licensing Services: 0.91%
Other Ancillary Operating Services: 0.86%
Consolidated revenue from operations grew from Rs 14,780.01 crore in FY24 to Rs 17,140.68 crore in FY25, and stood at Rs 16,601.31 crore in FY26 (5.98% 2-year CAGR), reflecting a slight moderation in FY26 due to SEBI regulatory measures introduced on index derivatives.
Profit After Tax (PAT) stood at Rs 8,305.74 crore in FY24, Rs 12,187.69 crore in FY25, and reached Rs 10,302.06 crore in FY26 (11.37% 2-year CAGR).
Operating margins have remained exceptionally high due to large operating leverage, with operating EBITDA margins standing at 66.78% in FY24, 73.78% in FY25, and 66.85% in FY26.
Key strengths include near-total market control across trading segments (92.99% cash market turnover, 99.79% equity futures, and 74.71% equity options premium), the Nifty 50 index benchmark brand monopoly (72.53% of Indian passive equity AUM), high-speed technology handling 12–14 billion daily messages, zero debt and Rs 64,771.28 crore in liquid treasury reserves.
Main risks include revenue dependence on options trading charges (60.22% of revenue), ongoing regulatory interventions by SEBI, pending legal settlements regarding past colocation and dark fibre matters, risk of operational system glitches and technology halts, and high revenue concentration from top brokers.
The Rs 22,562 crore IPO consists entirely of an Offer For Sale (OFS).
National Stock Exchange of India IPO is priced between Rs 1,700 and Rs 1,785 per share, with a minimum lot size of 8 shares.
Company Overview of National Stock Exchange of India IPO
NSE runs the electronic marketplace where millions of retail investors, mutual funds, banks, and foreign funds buy and sell securities every day. It also acts as the watchdog of the stock market to stop fraud and manipulation.
Its business works across four main segments:
Trading Markets:
Shares: Electronic trading for 2,978 listed companies (FY26) valued at Rs 411.25 lakh crore in total market value.
Derivatives (F&O): Trading contracts linked to popular indices (like Nifty 50, Bank Nifty) and individual company stocks.
Bonds, Currencies & Commodities: Trading in government and corporate debt, USD-INR currency contracts, and commodities like gold, crude oil, and natural gas.
GIFT City (International Market): A special financial hub in Gujarat allowing global investors to trade dollar-based Indian contracts round the clock.
Clearing and Trade Safety (NSE Clearing Limited):
Acts as a trusted middleman for every trade. Even if a buyer or seller runs out of money, NSE's safety fund (which holds over Rs 13,000 crore) ensures the other person gets their shares or money on time.
Indices and Brands (Nifty 50):
NSE owns the "Nifty" name. Around 72.53% of all index mutual funds and ETFs in India track Nifty benchmarks, earning the NSE a steady licensing fee.
Co-Location (Ultra-Fast Trading Servers):
NSE operates 1,680 colocation member racks across seven modern data centers, allowing brokers to place algorithmic orders with nanosecond speeds.
As of March 2026, over 12.91 crore individual investors across 99% of India's postal codes hold accounts on NSE.
Industry Overview of National Stock Exchange of India IPO
India's financial markets are growing steadily because of rapid financialization of household savings, expanding demat accounts, rising SIP flows, and strong structural reforms.
Market Area | Value in FY26 | Expected by FY30 | Expected Annual Growth |
Cash Market | Rs 280 lakh crore | Rs 473 – 507 lakh crore | 14% – 16% |
Equity Futures Market | Rs 394 lakh crore | Rs 715 – 765 lakh crore | 16% – 18% |
Equity Options Premium Market | Rs 190 lakh crore | Rs 269 – 289 lakh crore | 9% – 11% |
Source: Industry Research Reports, SEBI Bulletin, and NSE DRHP Industry Overview.
Why is Stock Exchange Business Unique?
More People are Investing: Indian households used to keep money mainly in fixed deposits, cash, or gold. Today, millions invest monthly through SIPs in mutual funds and direct stock accounts.
The "Network Effect" Moat: Traders want to trade where everyone else is already trading because it makes buying and selling quick and affordable. Because NSE has almost all the trading volume, it is challenging for a new exchange to pull traders away.
Heavy Regulations Keep Competitors Out: Setting up a rival exchange requires massive capital, strict government approvals, and strict safety funds, giving NSE a wide protective shield.
Investors can also explore different stock market sectors to understand how various industries contribute to India’s broader equity market.

Financial Overview of National Stock Exchange of India IPO
Metric | FY26 (Rs Crore) | FY25 (Rs Crore) | FY24 (Rs Crore) |
Total Revenue | 16,601.31 | 17,140.68 | 14,780.01 |
Operating Profit Margin | 66.85% | 73.78% | 66.78% |
Net Profit Margin | 50.98% | 55.30% | 47.13% |
Return on Equity (RoE) | 32.98% | 44.87% | 37.37% |
Return on Capital Employed (RoCE) | 42.80% | 52.11% | 45.50% |
Note: Financial figures are derived from the Restated Financial Information in the National Stock Exchange of India Limited DRHP.
Revenue from Operations: Revenue grew fast over the years as millions of new everyday investors joined and daily trading jumped. Growth paused slightly in FY26 because new SEBI rules cut down weekly options contracts and raised lot sizes, which slowed down high-risk short-term trading across the exchange.
EBITDA Margin: Operating profit margins stayed very strong because computer trading systems can handle huge spikes in trades without adding much daily working cost. Margins declined slightly in FY26 because NSE spent more money upgrading data servers and set aside funds to resolve old regulatory disputes.
Profit After Tax (PAT): Profit grew strongly with higher trading fees and safe investment earnings before flattening out in FY26. Slower trading and one-time regulatory settlement costs reduced core earnings, but overall profit remained solid due to steady interest income and profits from selling shares in associate companies.
Return Metrics: Returns on shareholder funds remain excellent because running a digital exchange needs computers and software rather than factories. These returns declined from previous peaks mainly because NSE saved large cash profits, growing its total net worth base faster than its yearly earnings.
Strengths and Risks of National Stock Exchange of India IPO
Let's examine the strengths and weaknesses to determine whether the National Stock Exchange of India IPO is good or bad for investors.
Strengths
Market Leader Across Trading Segments: Holds 92.99% market share in cash equities, 99.79% in equity futures, and 74.71% in equity options premium in FY26, creating an unmatched liquidity edge.
Profitability and Margins: Delivers industry-leading profitability with an operating EBITDA margin of 66.85% and a net profit margin of 50.98% in FY26, ranking among the highest globally.
Debt-Free Balance Sheet and Liquid Reserves: Operates with zero debt and holds Rs 64,771.28 crore in treasury investments and bank deposits.
Nifty 50 Benchmark Brand Monopoly: Owns the Nifty brand, which anchors 72.53% of Indian passive equity fund AUM (Rs 8.14 lakh crore) and 76.86% of passive schemes, generating stable recurring licensing income.
Globally Proven High-Speed Technology Platform: Handles 12 to 14 billion messages daily with nanosecond-order acknowledgement speeds, having handled peak sessions of 29.38 crore trades in a single day without data breaches.
Risks
Heavy Dependence on Options Trading Fees: 60.22% of revenue from operations (Rs 9,997.57 crore) comes directly from options trading charges, leaving revenues vulnerable to lower market volatility.
Regulatory Interventions by SEBI: Regulatory changes such as limiting weekly options expiries to one per exchange, higher lot sizes, and increased STT rates moderated derivatives turnover in FY26.
Declining Options Share and Regulatory Restrictions: Vulnerable to market share erosion in equity options (falling from 96.86% in FY24 to 74.71% in FY26) alongside regulatory curbs aimed at reducing speculative derivatives trading.
Risk of Technology Outages and Disincentives: Software glitches or telecom failures risk market halts, reputational damage, and automatic financial penalties under SEBI rules.
High Customer Concentration from Top Brokers: The top 10 trading members contributed 46.78% of total revenue from operations in FY26 (with the top 5 contributing 31.92%), creating client concentration risk.
Strategies of National Stock Exchange of India IPO
Expand Data Centers and Colocation Capacity: Deploy capital to add 2,000 full rack equivalents to meet rising demand from algorithmic and institutional traders.
Organize Large Commodity, Energy, and Coal Markets: Launch new electronic trading segments, including a national coal exchange (approved by SEBI in April 2026), electricity futures, and electronic gold receipts.
Deepen Primary Listings and the SME Platform: Expand the listing pipeline by encouraging fast-growing small enterprises to list on NSE EMERGE (554 listed SMEs in FY26) and the Social Stock Exchange.
Grow Global Footprint Through GIFT City: Scale cross-border trading on NSEIX via the NSEIX-SGX Connect, daily-expiry options (0DTE), and global investing through NSEIX Global Access.
Scale Predictable Market Data and Index Licensing: Increase non-trading revenue by selling real-time data feeds, specialized ESG benchmark indices, and analytics solutions to global asset managers.
National Stock Exchange of India IPO vs. Peers
The DRHP provides a comparison of the National Stock Exchange of India against its listed peers in the exchange industry for FY26:
Company | Revenue (Rs Crore) | Operating Margin | Net Profit Margin |
National Stock Exchange (NSE) | 16,601.31 | 66.85% | 50.98% |
4,833.95 | 64.00% | 48.00% |
Note:
Sourced from National Stock Exchange of India Limited RHP. Peer figures are consolidated FY26 data.
Multi Commodity Exchange of India (MCX) is not shown in the peer table as its scale is relatively smaller and it operates primarily in commodity derivatives, so in the DRHP it is not considered as a direct peer.
Objectives of National Stock Exchange of India IPO
National Stock Exchange of India's IPO consists entirely of an Offer for Sale (OFS) of up to 12.64 crore equity shares valued at Rs 22,562 crore by existing selling shareholders.
Since the IPO is a 100% offer-for-sale, NSE will not receive any proceeds from this public issue. All proceeds will go to the selling shareholders in proportion to the shares sold.
National Stock Exchange of India IPO Details
IPO Dates
National Stock Exchange of India IPO will be open for subscription from September 17, 2026, to September 21, 2026. The allotment of shares to investors will take place on September 22, 2026, and the company is expected to be listed on the BSE on September 24, 2026.
IPO Issue Price
The company is offering its shares in the price band of Rs 1,700 to Rs 1,785 per share. This means you would require an investment of Rs 14,280 per lot (8 shares) if you are bidding for the IPO at the upper price band.
IPO Size
They are launching an initial public offering consisting entirely of an Offer for Sale (OFS) of 12.64 crore shares, valued at Rs 22,562 crore.
IPO Allotment Status
Investors who applied for the IPO can check their IPO allotment status on September 22, 2026, through the registrar's website, MUFG Intime India Private Limited, BSE, or a stockbroker platform.
IPO Listing Date
The shares of the National Stock Exchange of India are expected to be listed on the BSE on September 24, 2026.
IPO Application Link
Open demat account with Rupeezy today and enjoy a seamless experience when applying for the IPO. With an easy-to-use platform, Rupeezy makes the IPO application process quick and hassle-free.
Apply for National Stock Exchange of India IPO
Important IPO Details | |
Bidding Date | September 17, 2026 to September 21, 2026 |
Allotment Date | September 22, 2026 |
Listing Date | September 24, 2026 |
Issue Price | Rs 1,700 to Rs 1,785 per share |
Lot Size | 8 Shares |

Santhosh is a Research Analyst at Rupeezy who transforms complex market data into actionable insights for investors. With five years of financial industry experience and an MBA in Finance from Jain University, he specializes in evaluating stock market dynamics, mutual fund performance, and ETF trends. Driven by a deep passion for business analysis, Santhosh focuses heavily on company fundamentals to help readers make informed, data-backed financial decisions.
Did you like this blog?
Be the first to like this blog.
Disclaimer
Investments in the securities market are subject to market risks. Read all the related documents carefully before investing. Rupeezy (SEBI RA Registration: INH000013332) provides this content for informational purposes; any securities quoted are for educational display and not as a recommendation. All charts and graphs are based on independent research and reliable sources for the period mentioned within the specific data set. Sometimes we take graphs from external sources. This communication does not promise or assure any fixed, guaranteed, or indicative returns to any client. For our complete registered office address, Member ID, and full SEBI registration details, please refer to our official website.
The content on this blog is for educational purposes only and should not be considered investment advice. While we strive for accuracy, some information may contain errors or delays in updates.
Mentions of stocks or investment products are solely for informational purposes and do not constitute recommendations. Investors should conduct their own research before making any decisions.
Investing in financial markets are subject to market risks, and past performance does not guarantee future results. It is advisable to consult a qualified financial professional, review official documents, and verify information independently before making investment decisions.





All Category