
Open a Free Demat Account !
₹0 AMC & Account Opening Fee
Tonbo Imaging IPO Review: Good or Bad?

 Last Updated: 14 October, 2026
 17 min read




00:00 / 00:00


Quick summary
| ||
Is the Tonbo Imaging IPO good or bad? Going by the numbers, it is a company with real technology, a confirmed order book of Rs. 314.24 crore and an asset-light model, but it asks for a price of about 79 times earnings after a year in which revenue and profit both fell, cash flow turned negative and the first quarter of FY27 was a loss. Whether that trade-off suits you depends on how much risk you can carry, so this article lays out the evidence instead of a one-word verdict.
We read the Red Herring Prospectus (RHP) that Tonbo Imaging India Limited filed with SEBI, dated 10 October 2026, and pulled the figures that matter for an investor. Every number below comes from it unless we name another source. If the document is new to you, our guide to the red herring prospectus explains each section.
Investments in the securities market are subject to market risks. Read all the related documents carefully before investing. This article is for education and is not investment advice.
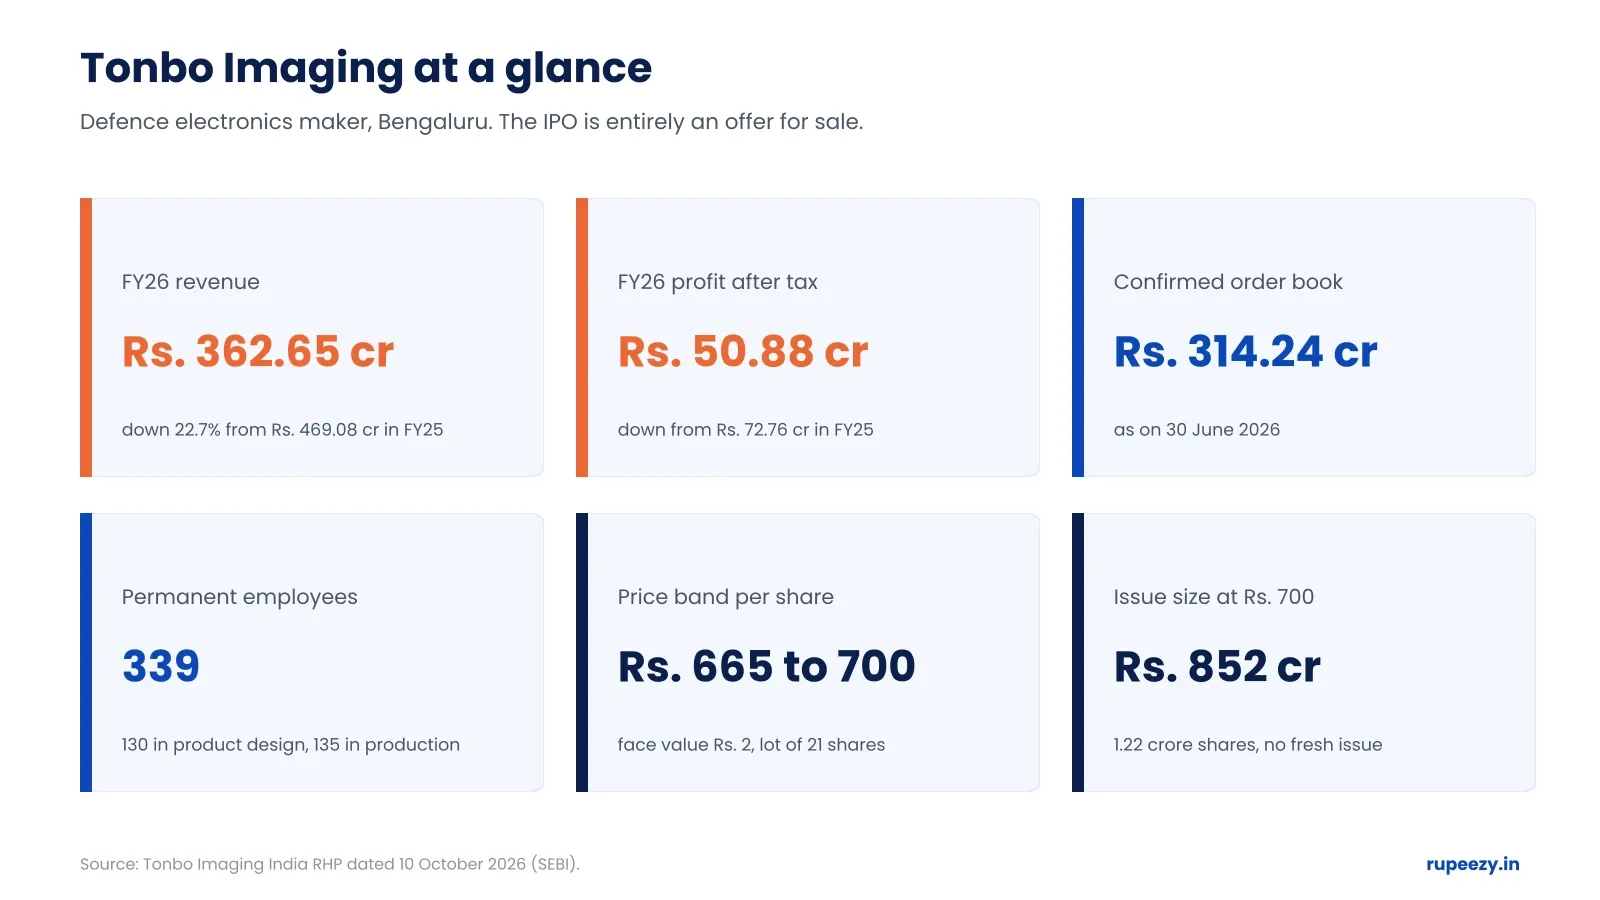
Tonbo Imaging key numbers. Source: RHP dated 10 October 2026 (SEBI); price band and lot size are from media reports of the company's announcement.

Tonbo Imaging IPO Details
Here are the terms you need before you bid. The bidding dates come from the RHP. The RHP leaves the price band and lot size blank, because they are announced separately, so we took them from media reports of the company's announcement. Check them against the final price band advertisement and your bid form.
Detail | Tonbo Imaging IPO |
Issue type | Book-built; 100% offer for sale (Regulation 6(1) of SEBI ICDR) |
Fresh issue | None |
Offer for sale | 1,21,74,046 equity shares of face value Rs. 2 |
Total issue size | About Rs. 852 crore at Rs. 700 (our calculation) |
Listing | BSE and NSE; NSE is the designated stock exchange |
Anchor bidding | 14 October 2026 |
Bidding opens / closes | 15 October 2026 / 19 October 2026; UPI mandate cut-off 5:00 pm on the last day |
Price band | Rs. 665 to Rs. 700 per share (media report) |
Lot size | 21 shares (media report) |
Minimum bid | Rs. 14,700 at Rs. 700 |
Maximum for retail investors | 13 lots (273 shares), Rs. 1,91,100 at Rs. 700 (our calculation) |
Quota | QIBs not more than 50%; non-institutional investors not less than 15%; retail investors not less than 35% of the net offer |
Employee reservation | Up to 14,000 shares |
Registrar | KFin Technologies Limited |
Lead managers | JM Financial and IIFL Capital Services |
The quota is the detail to notice. Under Regulation 6(1), retail investors are reserved at least 35% of the net offer and institutions at most 50%. That is a larger retail share than in loss-making IPOs filed under Regulation 6(2), where retail can be limited to 10%. A bigger quota does not guarantee allotment, which depends on how many people bid.
What Does Tonbo Imaging Do?
Tonbo Imaging designs electro-optic and infrared systems for armed forces: thermal cameras, thermal binoculars, targeting and fire-control systems, missile seekers and the sensors for remote weapon stations. Its customers are militaries, security agencies and other defence manufacturers. The company says that between April 2024 and March 2026 it was the largest seller of thermal imaging systems to Indian government and defence agencies by value, and that it held 94% of India's thermal imaging exports by units. Both claims come from a Frost & Sullivan report that Tonbo commissioned and paid for, so treat them as the company's own case.
The business has three features worth knowing:
Design in-house, make outside. Core design and intellectual property sit in Bengaluru, where 130 engineers work (about 38% of 339 permanent staff). Production is outsourced to electronics manufacturers such as Kaynes Technology and Avalon Technology, so the company needs little factory investment.
Two product lines. Tactical systems brought in Rs. 211.68 crore in FY26 (58.4% of revenue). Platform systems, which combine several subsystems into one integrated unit, brought Rs. 144.81 crore (39.9%) and have grown from Rs. 12.70 crore in FY24.
Own technology. Tonbo says it owns 100% of its intellectual property since March 2024, when it bought it from CEAQ Singapore, a shareholder that is also selling in this IPO.
By customer, Indian government bodies gave 71.2% of FY26 revenue and private system integrators 24.1%. Foreign governments gave only 3.3%, down from 57.1% in FY25.
Who Owns Tonbo Imaging and Who Is Selling?
Before the offer the three promoters, Arvind Kondangi Lakshmikumar, Ankit Kumar and Cecilia D'Souza, hold 17.42% together on a fully diluted basis (8.67%, 5.30% and 3.45%). Vinimaya Advisory LLP, a promoter group entity, holds 1.15%. The largest outside holders are CEAQ Singapore (25.47%), HBL Engineering (14.25%) and CEAQ India (8.73%).
Because this is a pure OFS, every share sold comes out of an existing holder's stake:
Seller | Shares offered | Share of offer |
CEAQ Technologies India (investor) | 49,98,100 | 41.1% |
CEAQ Technologies Singapore (investor) | 41,55,096 | 34.1% |
Three promoters (Lakshmikumar 11,50,000; Ankit Kumar 5,80,000; D'Souza 2,30,000) | 19,60,000 | 16.1% |
Vinimaya Advisory LLP (promoter group) | 3,39,700 | 2.8% |
Other investors and individuals (seven names) | 7,21,150 | 5.9% |
Total | 1,21,74,046 | 100% |
The two CEAQ entities together sell 91,53,196 shares, about 75.2% of the offer (our calculation). Early investors exiting is common in IPOs and is not a warning sign on its own, but it is why the Rs. 852 crore does not reach the company. Tonbo will not use this issue to build capacity, repay debt or fund working capital, and you should not read it as a fund-raising round.
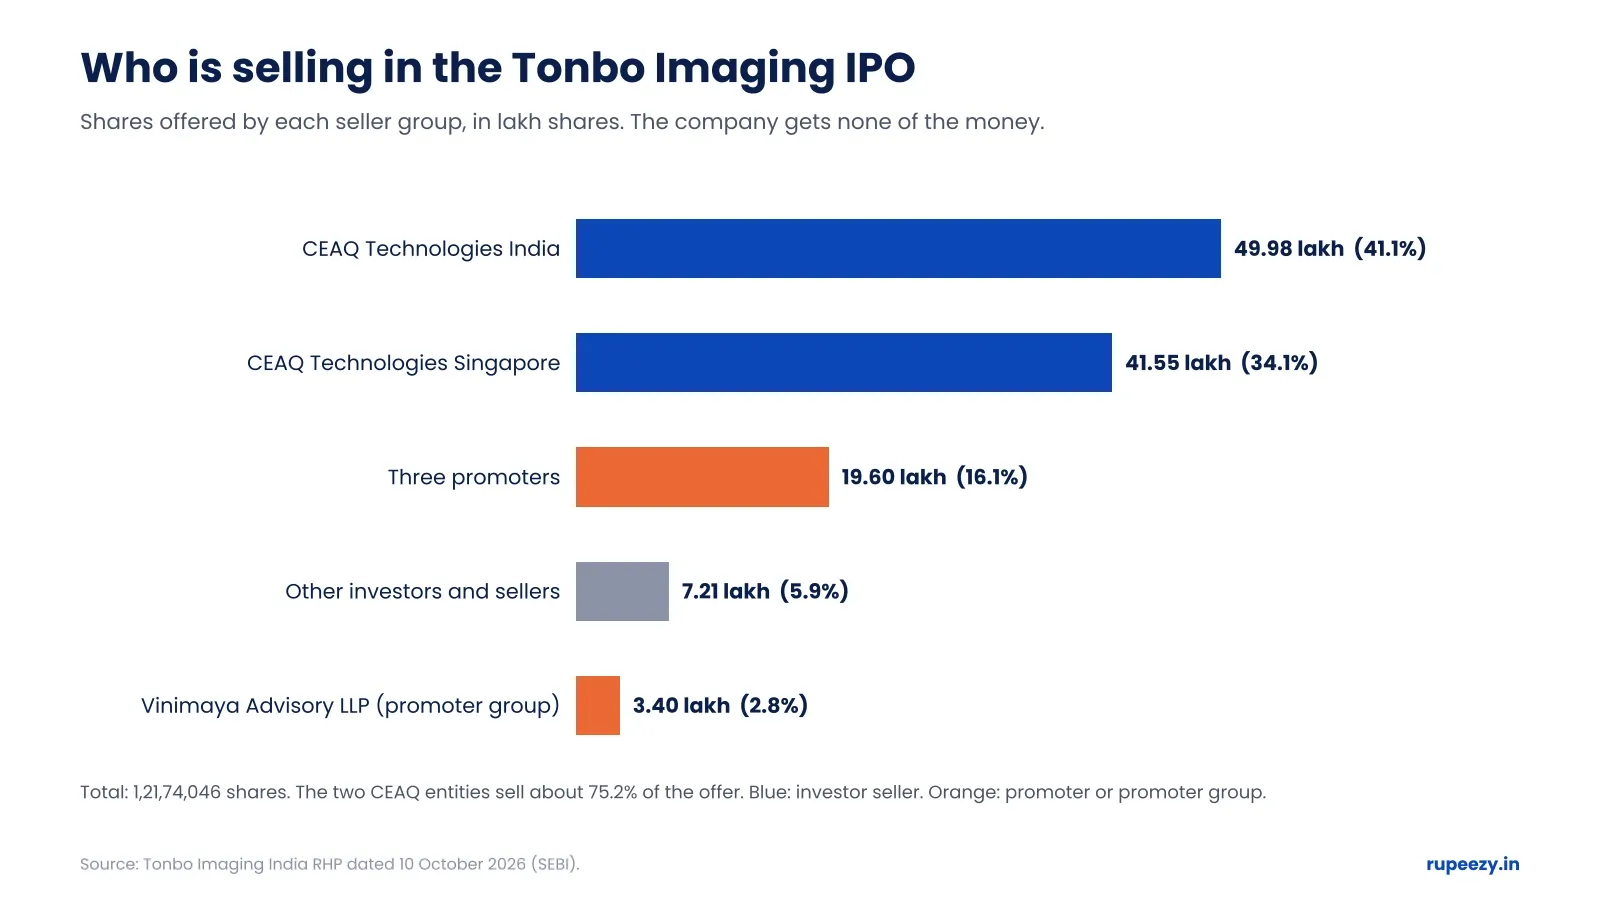
Who sells in the Tonbo Imaging offer for sale. Source: RHP dated 10 October 2026 (SEBI); percentages are our calculation.

Tonbo Imaging Financials: Strong Margins, Falling Sales
All figures are restated consolidated numbers in Rs. crore, converted from the RHP's Rs. million figures, for the years ended 31 March.
Metric (Rs. crore) | FY24 | FY25 | FY26 | Apr to Jun 2026 |
Revenue from operations | 428.19 | 469.08 | 362.65 | 36.01 |
Revenue growth | 342.22% | 9.55% | -22.69% | n/a |
Gross profit margin | 48.64% | 56.38% | 51.05% | 37.71% |
EBITDA | 112.32 | 139.06 | 104.62 | -13.04 |
EBITDA margin | 26.23% | 29.65% | 28.85% | -36.21% |
Profit after tax | 68.54 | 72.76 | 50.88 | -17.74 |
Return on equity | 52.72% | 20.20% | 9.75% | -3.25% (not annualised) |
Return on capital employed | 67.76% | 27.41% | 14.54% | -4.31% (not annualised) |
Net worth | 230.13 | 490.14 | 553.16 | 538.54 |
Diluted EPS (Rs.) | 13.63 | 12.70 | 8.88 | -3.20 (not annualised) |
Three things stand out. First, margins are high for a hardware company. EBITDA margin has stayed between 26% and 30%, which reflects that Tonbo sells its own design rather than assembling someone else's. Second, the top line is not smooth. Revenue grew 9.55% in FY25 and then fell 22.69% in FY26. The RHP puts this down to delays in some international orders because of the West Asia conflict and to some expected orders slipping from FY26 into FY27. Third, returns on equity and capital employed have fallen every year as revenue dropped and the equity base grew.
The April to June 2026 quarter was a loss of Rs. 17.74 crore on Rs. 36.01 crore of revenue. The RHP says the company's revenue is concentrated in the second half of the financial year, so one weak first quarter does not mean the year will be weak. Still, you are paying for FY26 earnings that have already fallen, and the latest quarter did not show a recovery.
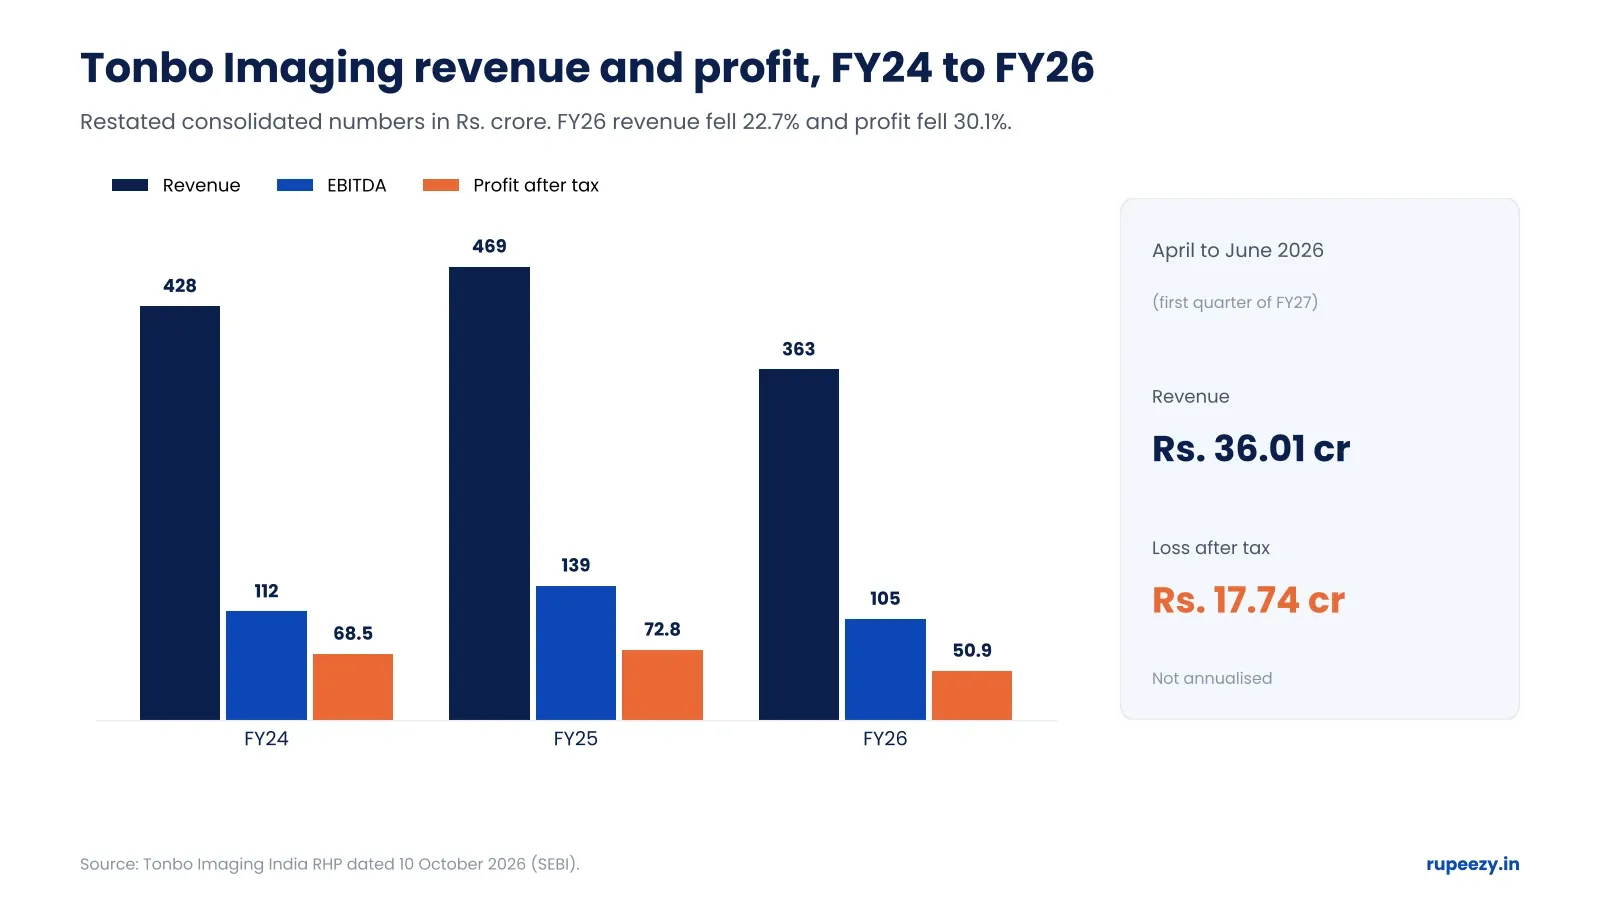
Tonbo Imaging revenue, EBITDA and profit after tax, FY24 to FY26. Source: RHP restated consolidated financials (SEBI).
Cash Flow: Profit That Did Not Become Cash
For a company that builds equipment to order, cash flow shows what the profit line cannot.
Cash flow (Rs. crore) | FY24 | FY25 | FY26 | Apr to Jun 2026 |
From operating activities | 78.33 | -136.12 | -63.22 | -14.68 |
Tonbo reported profits of Rs. 72.76 crore in FY25 and Rs. 50.88 crore in FY26, yet operations used cash in both years. The reason is tied-up money. Inventory rose from Rs. 111.14 crore at March 2025 to Rs. 219.49 crore at March 2026 and Rs. 319.63 crore at June 2026. Working capital days, a measure of how long cash stays locked in the business, went from 152 in FY24 to 280 in FY25 and 517 in FY26. The RHP notes that the June 2026 figure of 1,454 days is not comparable with the annual numbers because of the cyclical pattern of revenue.
One other item sits in FY24 to FY26 cash flow: a one-time purchase of intellectual property from CEAQ Singapore for Rs. 183.19 crore, paid over the three years. The RHP says it was cheaper to buy the IP than to keep paying royalty to a related party. It also means a selling shareholder received that money before the IPO. Ask whether growing orders will release the inventory, because that is what turns the profit into cash.
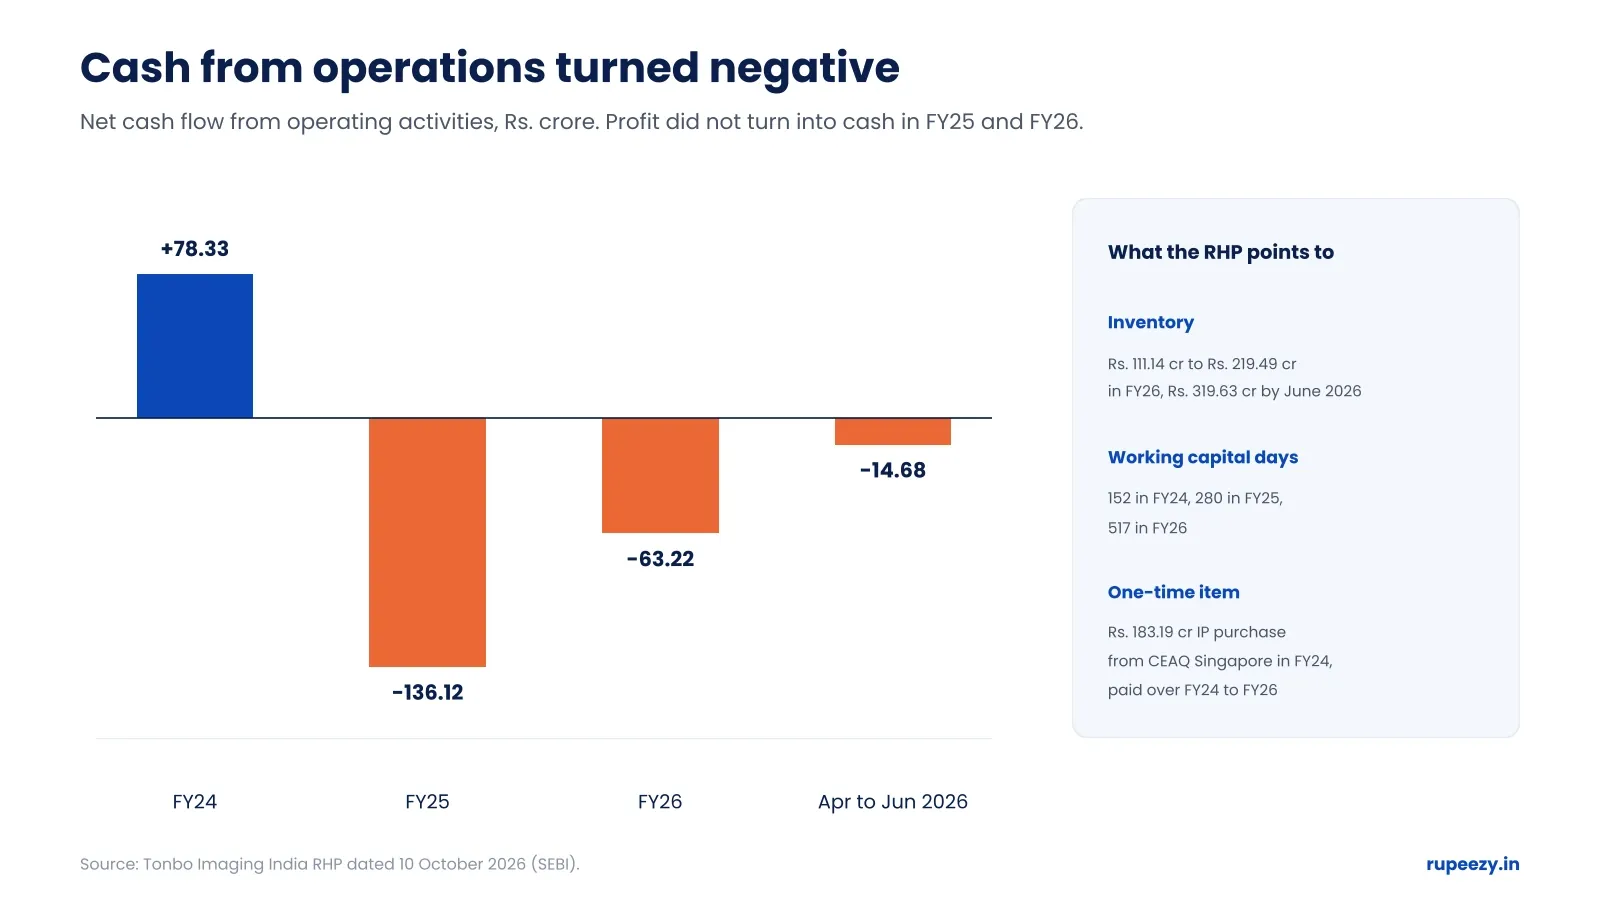
Tonbo Imaging operating cash flow. Source: RHP restated consolidated cash flow statement (SEBI).
Order Book, Exports and Customers
Tonbo sells mostly through government tenders, so orders arrive in lumps. The confirmed order book, which counts only contractually confirmed firm orders, was Rs. 563.14 crore at March 2024, Rs. 218.61 crore at March 2025, Rs. 279.02 crore at March 2026 and Rs. 314.24 crore at June 2026. At June 2026 it held 36 orders: 30 domestic worth Rs. 231.87 crore and 6 overseas worth Rs. 82.37 crore. Between July and September 2026 the company received another Rs. 118.15 crore of orders. Rs. 51.44 crore of the June 2026 order book is an export order that slipped from FY26.
The bid win rate gives a second signal. Tonbo won 40.9% of the bids it submitted in FY24, 35.9% in FY25 and 34.4% in FY26 (45 of 131). In April to June 2026 it won 2 of 14, or 14.3%. The sample for the latest quarter is small, so do not read too much into it, but it is a number to track.
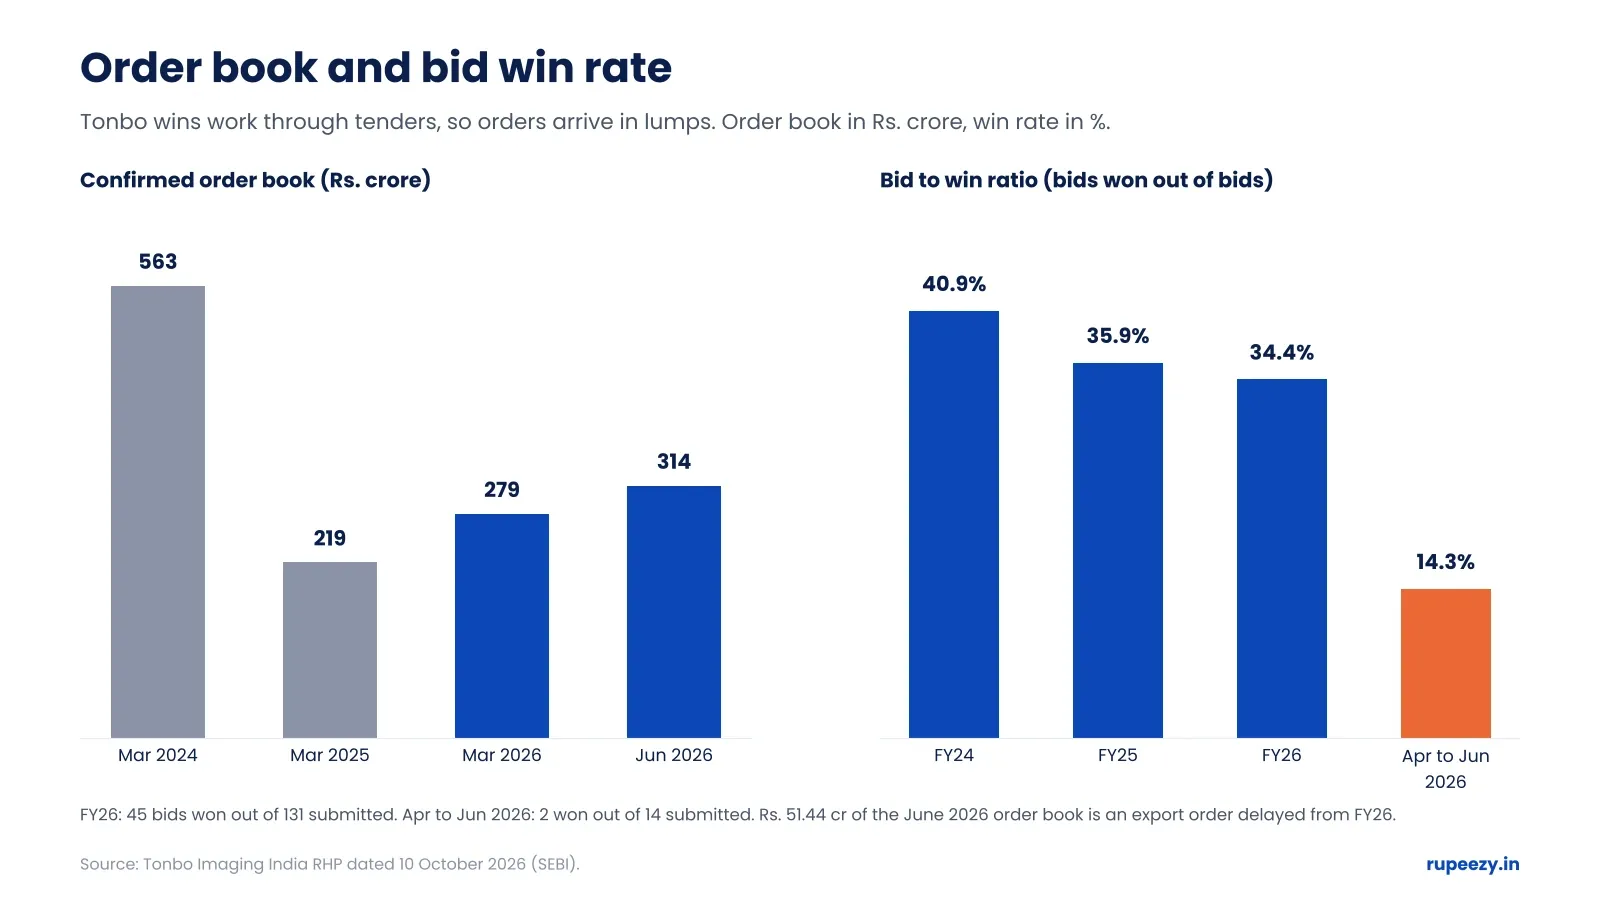
Tonbo Imaging order book and bid to win ratio. Source: RHP (SEBI).
Customer concentration is the other thing to check. The top five customers gave 53.0% of FY26 revenue and 92.1% in the June 2026 quarter. In FY25 a single customer alone gave 57.07% of revenue, and in FY24 the same customer gave 44.11%. That customer was not the largest in FY26. Exports followed the same pattern: 48.6% of revenue in FY24, 65.5% in FY25, 5.6% in FY26 and 0.25% in the June 2026 quarter. The company does not disclose customer names, citing defence confidentiality. When one buyer can account for more than half of a year's sales, the order book of the next year can look very different.
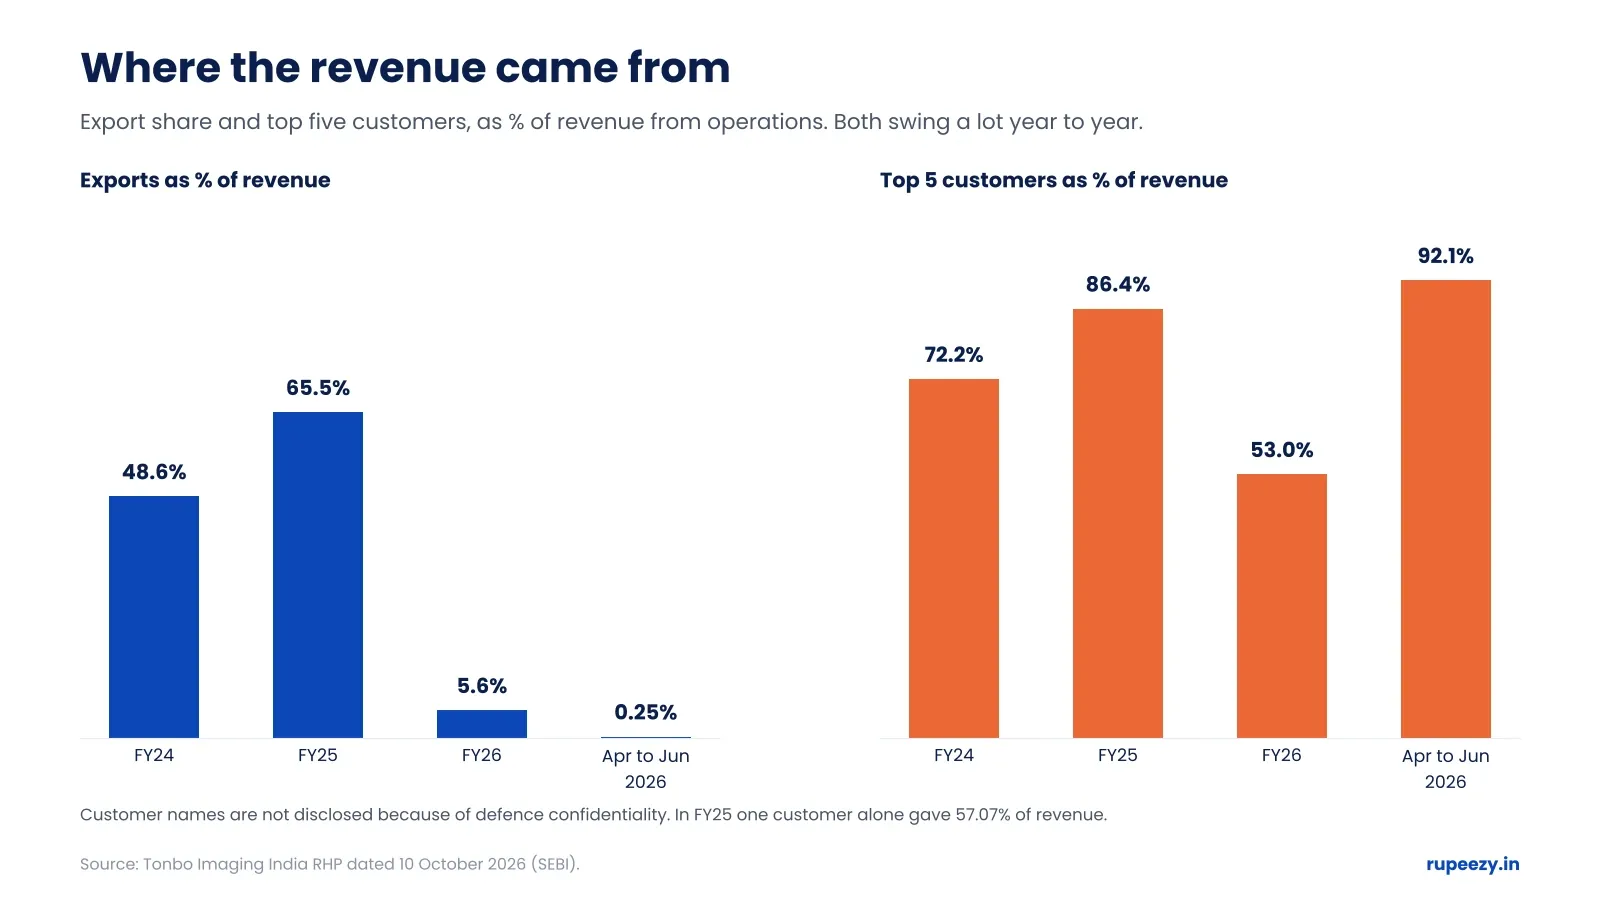
Tonbo Imaging exports and top five customers as a share of revenue. Source: RHP (SEBI).
Can You Judge the Price?
The RHP lists the P/E ratios of five listed defence companies at 7 October 2026 closing prices, using FY26 diluted earnings per share. Using the reported upper band of Rs. 700 and Tonbo's FY26 diluted EPS of Rs. 8.88, we get a price-to-earnings (P/E) ratio of about 78.8 (our calculation).
Company | P/E (FY26 diluted EPS) |
Paras Defence and Space Technologies | 117.74 |
Data Patterns (India) | 87.29 |
Astra Microwave Products | 83.92 |
Tonbo Imaging at Rs. 700 (our calculation) | 78.80 |
Zen Technologies | 73.44 |
Bharat Electronics | 45.70 |
Average of the five listed peers | 81.62 |
On this table Tonbo sits just under the peer average, which can look reasonable. Two cautions apply. First, the peers are established, profitable companies, and several are much larger, so a similar multiple is not the same as a similar quality of earnings. Second, Tonbo's multiple is calculated on a profit that fell 30.1% and was followed by a loss in the latest quarter.
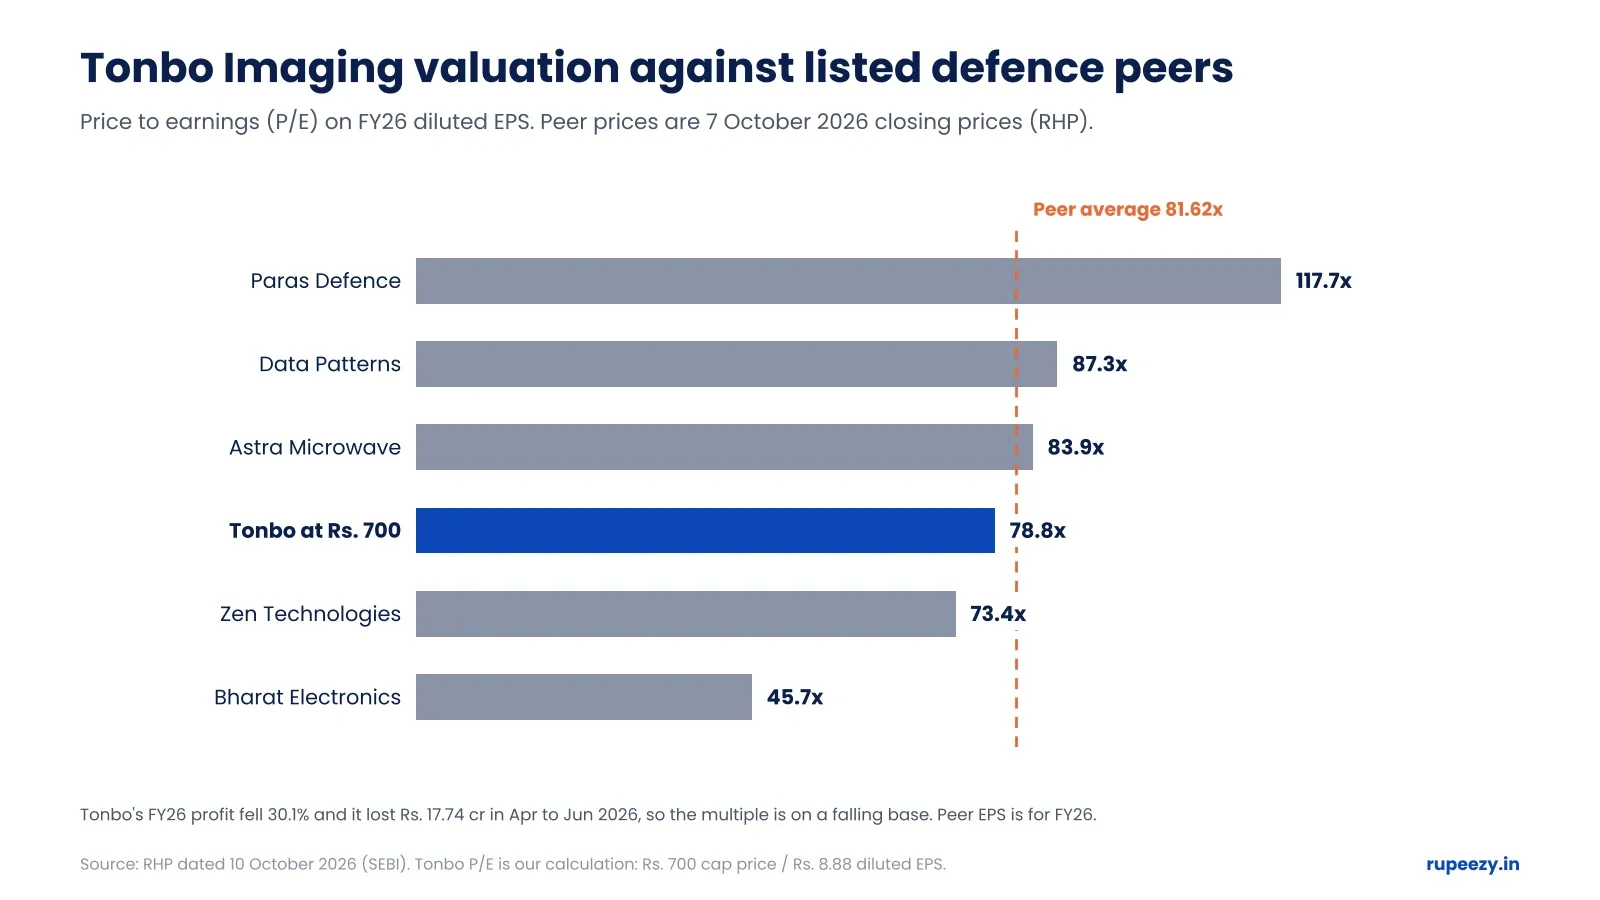
Tonbo Imaging P/E against listed defence peers. Source: RHP (SEBI); the Tonbo P/E is our calculation.
Strengths of the Tonbo Imaging IPO
Owned technology: Tonbo says it owns 100% of its intellectual property and its infrared portfolio is free of U.S. ITAR export restrictions, which lets it sell to more countries.
High margins: EBITDA margin of 28.85% in FY26 and gross margin of 51.05%, on an asset-light model.
Product shift: Platform systems grew from 3.0% of revenue in FY24 to 39.9% in FY26, a move toward bigger integrated contracts.
Order flow: A confirmed order book of Rs. 314.24 crore at June 2026, plus Rs. 118.15 crore of orders received between July and September 2026.
Clean audit reports: The auditors report no qualifications, reservations or emphasis of matters for the last three years and the June 2026 quarter.
No criminal cases: The RHP discloses no outstanding criminal proceedings against the company, its subsidiaries or its directors.
Retail quota: At least 35% of the net offer is reserved for retail investors.
Risks of the Tonbo Imaging IPO
Risk | What the RHP shows |
Lumpy, tender-based revenue | Revenue depends on government budgets and tenders. The RHP says this gives poor revenue visibility, and revenue fell 22.69% in FY26. |
Customer concentration | The top five customers gave 53.0% of FY26 revenue and 92.1% in the June 2026 quarter. One customer gave 57.07% in FY25. |
Falling profit and a loss quarter | Profit fell from Rs. 72.76 crore to Rs. 50.88 crore in FY26, and the company lost Rs. 17.74 crore in April to June 2026. |
Cash conversion | Operating cash flow was negative in FY25, FY26 and the June 2026 quarter, and working capital days rose to 517 in FY26. |
Outsourced manufacturing | Production depends on a few electronics manufacturing partners such as Kaynes and Avalon, on non-exclusive contracts. |
Limited component suppliers | The RHP says the company depends on a limited number of global suppliers for critical components. |
Related-party history | The core IP was bought from CEAQ Singapore, a shareholder that is also a seller in this IPO. |
No money for the company | It is a 100% OFS, so the issue adds no cash for growth or working capital. |
Falling bid win rate | Tonbo won 14.3% of bids in April to June 2026 against 34.4% in FY26. |
Industry data is company-paid | Market share and industry claims come from a Frost & Sullivan report that Tonbo commissioned and paid for. |
Tonbo Imaging IPO: Good or Bad?
There is no single answer. This table sets out what points each way.
Question | Points to good | Points to bad |
Growth | Platform systems up from Rs. 12.70 crore to Rs. 144.81 crore in two years | Revenue fell 22.69% in FY26 |
Profit | EBITDA margin near 29% in FY26 | Profit fell 30.1% and April to June 2026 was a Rs. 17.74 crore loss |
Cash | Profit has been positive in each full year | Operating cash flow negative in FY25 and FY26 |
Orders | Order book of Rs. 314.24 crore and Rs. 118.15 crore of new orders to September | Order book was Rs. 563.14 crore in March 2024; win rate fell |
Customers | Indian government gave 71.2% of FY26 revenue | One customer gave 57.07% in FY25; top five were 92.1% in Q1 FY27 |
Price | P/E of about 78.8 is under the peer average of 81.62 | On a falling profit base; about 7.2 times net asset value |
Use of money | Early investors get an exit and the promoters keep a stake | The company receives none of the Rs. 852 crore |
Allotment | At least 35% of the net offer is for retail | Allotment still depends on how many people bid |
If you want a company with a steady, growing profit record, this one does not fit yet, because the latest numbers point the other way. If you are willing to back a defence technology company on the strength of its margins and order pipeline, and you can accept lumpy revenue and a high multiple, it is the type of bet some investors make with a small slice of their money. Only you can decide that.
Questions to Settle Before You Bid
Can you hold through a quarter or two of weak revenue if tenders are delayed?
Are you comfortable paying about 79 times FY26 earnings when FY26 earnings fell?
Have you read the RHP's risk factors on customer concentration and on the CEAQ related-party IP purchase?
How much of your portfolio would one lot at Rs. 14,700, or 13 lots at Rs. 1,91,100, be, and can you accept a total loss on it?
Have you confirmed the final price band and lot size on the exchange websites?
How to Apply for Tonbo Imaging IPO on Rupeezy
If you decide to bid, you can apply through Rupeezy. Rupeezy's IPO page states "Zero fees on IPOs. Free account opening," so there is no charge for applying. That is a fact about our pricing, not a reason to bid. Rupeezy is a stockbroker and earns from other services if you become a client, which has no bearing on the analysis above.
Open a demat account. Open a free demat account with Rupeezy and finish the online KYC.
Keep a UPI ID ready. It must be linked to the bank account that holds your funds.
Go to the IPO section. Log in, open the IPO page and select Tonbo Imaging. Bidding runs from 15 to 19 October 2026; check the live window in the app.
Choose your bid. Pick the number of lots (1 to 13 for retail investors) and a price within the band, or bid at the cut-off price.
Approve the UPI mandate. The amount is blocked in your account, not debited, until shares are allotted.
Track allotment. Check it on the Rupeezy IPO allotment status page, the KFin Technologies website, BSE or NSE once the allotment date is announced.
New to this? Our step-by-step guide to applying for an IPO online covers the process.
Apply for Tonbo Imaging IPO | Open a free demat account
Frequently Asked Questions
Is the Tonbo Imaging IPO good or bad?
The RHP shows EBITDA margins near 29% and a confirmed order book of Rs. 314.24 crore, but also a 22.69% fall in FY26 revenue, a 30.1% fall in profit, negative operating cash flow in FY25 and FY26 and a loss in April to June 2026. It suits investors who accept lumpy defence orders and a high multiple; it does not suit those who want steady growth. This is information, not a recommendation.
What is the Tonbo Imaging IPO price band and lot size?
Media reports of the company's announcement give a price band of Rs. 665 to Rs. 700 per share and a lot size of 21 shares, so the minimum bid is Rs. 14,700 at the upper band. The RHP leaves these blank, so confirm them on the exchange websites before you bid.
When does the Tonbo Imaging IPO open and close?
The RHP gives anchor bidding on 14 October 2026, with the public issue open from 15 October to 19 October 2026. The UPI mandate cut-off is 5:00 pm on 19 October. Allotment and listing dates follow the exchange timetable.
How big is the Tonbo Imaging IPO?
It is a 100% offer for sale of 1,21,74,046 shares, about Rs. 852 crore at Rs. 700 (our calculation). There is no fresh issue, so the company receives none of the money.
Who is selling shares in the Tonbo Imaging IPO?
The two CEAQ entities sell about 75.2% of the offer (CEAQ Technologies India 49,98,100 shares and CEAQ Technologies Singapore 41,55,096 shares). The three promoters sell 19,60,000 shares, Vinimaya Advisory LLP 3,39,700 shares and other investors the balance.
Is Tonbo Imaging profitable?
Yes for the full years: restated profit after tax was Rs. 68.54 crore in FY24, Rs. 72.76 crore in FY25 and Rs. 50.88 crore in FY26. The April to June 2026 quarter was a loss of Rs. 17.74 crore on Rs. 36.01 crore of revenue.
How much can a retail investor bid for in the Tonbo Imaging IPO?
A retail investor can bid for up to 13 lots, which is 273 shares or Rs. 1,91,100 at Rs. 700, because the retail limit is Rs. 2 lakh. At least 35% of the net offer is reserved for retail investors.
How do I apply for the Tonbo Imaging IPO on Rupeezy?
Open a demat account with Rupeezy, log in, go to the IPO section, select Tonbo Imaging, choose your lots and price, and approve the UPI mandate. Rupeezy states zero fees on IPOs and free account opening.
Sources
Tonbo Imaging India Limited, Red Herring Prospectus dated 10 October 2026, filed with SEBI: sebi.gov.in. Source for financials, cash flow, order book, customers, ownership, selling shareholders, offer structure, bid dates, peer P/E ratios, risk factors and litigation.
Tonbo Imaging India Limited, abridged prospectus, hosted by SEBI: sebi.gov.in.
Frost & Sullivan industry report, as cited in the RHP.
All data is as of 14 October 2026. Figures in Rs. crore are converted from the RHP's Rs. million figures and rounded. Totals, shares of the offer, the Tonbo P/E, net asset value multiple, implied market value and retail bid limits are our calculations from RHP data and the reported price band.

Santhosh is a Research Analyst at Rupeezy who transforms complex market data into actionable insights for investors. With five years of financial industry experience and an MBA in Finance from Jain University, he specializes in evaluating stock market dynamics, mutual fund performance, and ETF trends. Driven by a deep passion for business analysis, Santhosh focuses heavily on company fundamentals to help readers make informed, data-backed financial decisions.
Did you like this blog?
Be the first to like this blog.
Disclaimer
Investments in the securities market are subject to market risks. Read all the related documents carefully before investing. Rupeezy (SEBI RA Registration: INH000013332) provides this content for informational purposes; any securities quoted are for educational display and not as a recommendation. All charts and graphs are based on independent research and reliable sources for the period mentioned within the specific data set. Sometimes we take graphs from external sources. This communication does not promise or assure any fixed, guaranteed, or indicative returns to any client. For our complete registered office address, Member ID, and full SEBI registration details, please refer to our official website.
The content on this blog is for educational purposes only and should not be considered investment advice. While we strive for accuracy, some information may contain errors or delays in updates.
Mentions of stocks or investment products are solely for informational purposes and do not constitute recommendations. Investors should conduct their own research before making any decisions.
Investing in financial markets are subject to market risks, and past performance does not guarantee future results. It is advisable to consult a qualified financial professional, review official documents, and verify information independently before making investment decisions.




All Category