What Is Market Turnover in the Stock Market?

00:00 / 00:00
Key Highlights
|

Market turnover in the stock market defines the total value of the securities that are traded in the market during any day. This is quite common in the stock market, but if you ever check the news, you won’t find the same mentioned a lot.
But if you deeply evaluate the market turnover, meaning you will see if it shows the quality of trading, the buying and selling value, and how the market is moving. While this is just the basic overview, you would need to dive in deep.
So, read this guide to find the details and understand how the share turnover volume is crucial for the market as well as for traders and investors.
What Is Market Turnover?
Market turnover is defined as the total number of securities which are traded on the stock exchange for a particular time. The period can be a single trading session, a week, a month, or even a year.
In simple terms, it shows the total amount of money involved in stock market transactions.
Every time investors buy and sell shares, a transaction takes place. Now, when all the transactions in a period are combined, the total value which you get is known as the market turnover.
So, to understand the market turnover in simple words, you can check the sample below:
Say, 10,000 shares of a company are traded at Rs. 500 each. Now, when you wish to find the total turnover of the same, you would need to calculate as follows:
10,000 × Rs. 500 = Rs. 50,00,000
Here, you would see that there is an impact of the following two aspects:
Number of shares traded = Trading Volume
Value of shares traded = Market Turnover
This is why turnover is often considered a better indicator of the actual money flowing through the market.
How Is Market Turnover Calculated?
The market turnover calculation is fairly simple. You first take the total quantity of the shares that are traded. This value is then multiplied by their price when they are being traded. This gives you the share turnover volume.
Market Turnover Formula
Market Turnover = Total Quantity Traded × Market Price
Now that you understand this better, here is a quick market turnover calculation example for you.
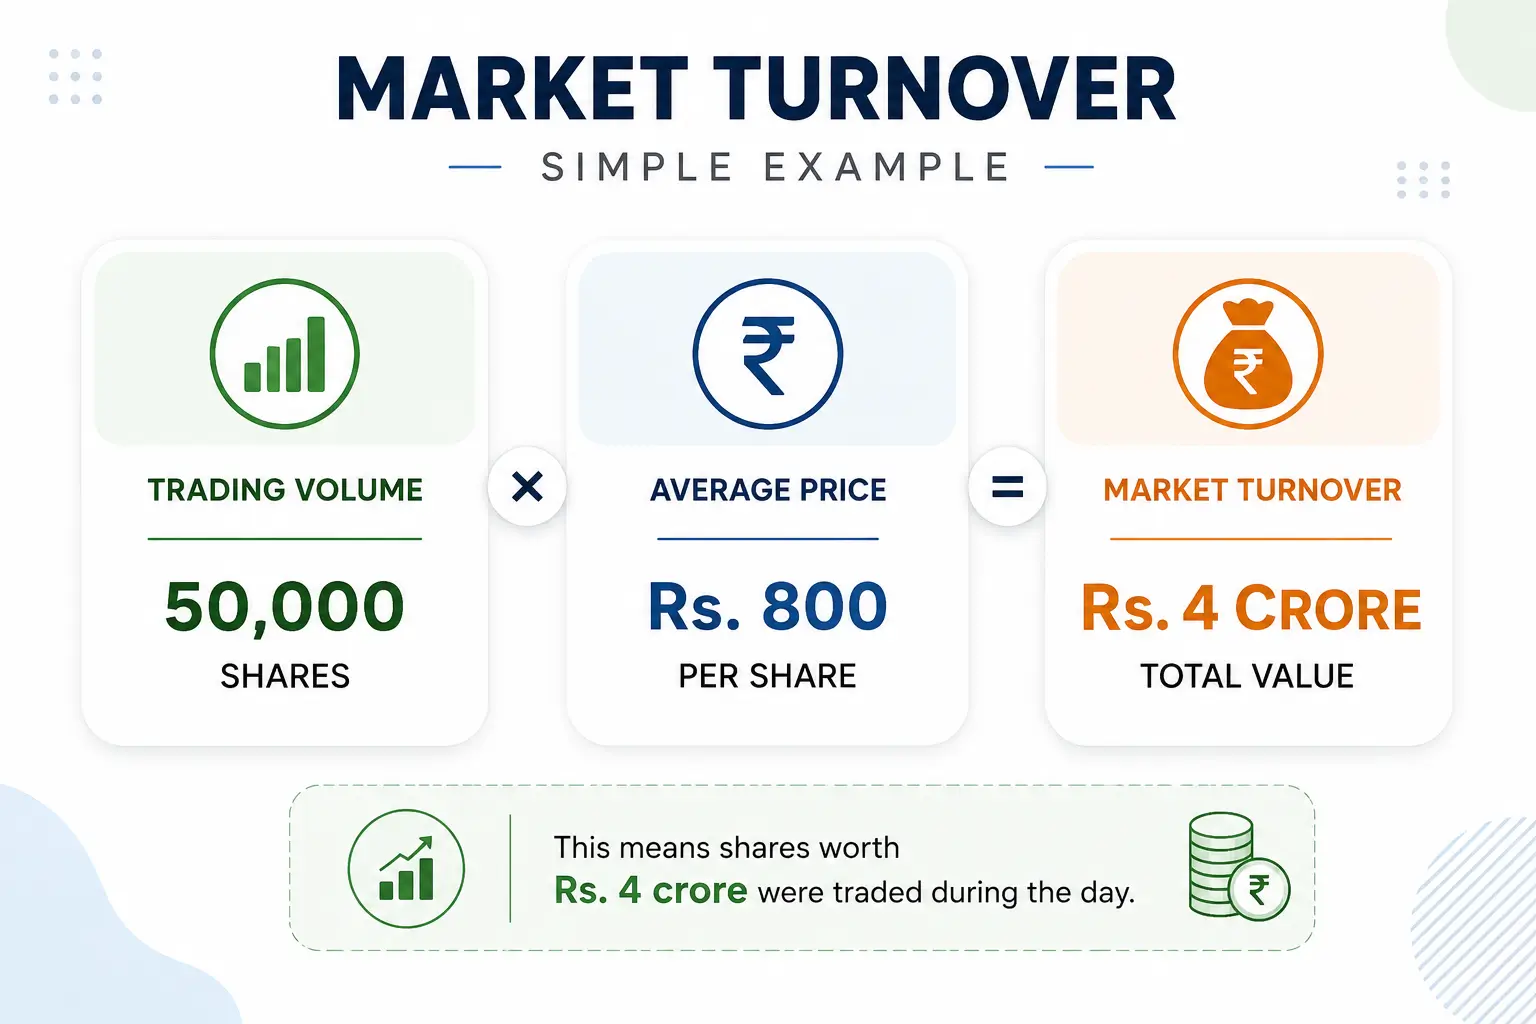
Suppose a stock records a trading volume of 50,000 shares during a day.
Now, the average trading price is Rs. 800.
Market Turnover = 50,000 × Rs. 800
Market Turnover = Rs. 4 Crore
This means shares worth Rs. 4 crore were traded during the day.
Knowing the daily turnover of NSE will help you get an idea of the market liquidity, trading cycles, and demand, which is key to better planning and decision-making.

Types of Market Turnover
The overall market turnover is divided into different groups based on the nature of the securities. So, here are the ones that you should know of.
Type of Market Turnover | Meaning | Examples |
Equity Market Turnover | Total value of shares traded in the cash market. | Reliance Industries, TCS, Infosys, HDFC Bank. |
Derivatives Market Turnover | Total value of futures and options contracts traded. | Nifty Futures, Bank Nifty Options, Stock Futures. |
Commodity Market Turnover | Total value of commodity contracts traded on commodity exchanges. | Gold or Silver, Crude Oil, Natural Gas. |
Currency Market Turnover | Total value of currency contracts traded in the forex derivatives market. | USD/INR, EUR/INR, GBP/INR, JPY/INR. |
Debt Market Turnover | Total value of debt securities traded during a period. | Government Securities (G-Secs), Corporate Bonds, Treasury Bills. |
Among these, derivatives market turnover generally accounts for the largest share on any day. By analysing the trading turnover, you can see which segment is more liquid and which is not.
Why Do Investors Use Turnover Analysis?
Market turnover is more than just a trading statistic. Investors and traders use turnover analysis to understand the market well. Some of the reasons why you should focus on turnover analysis are:
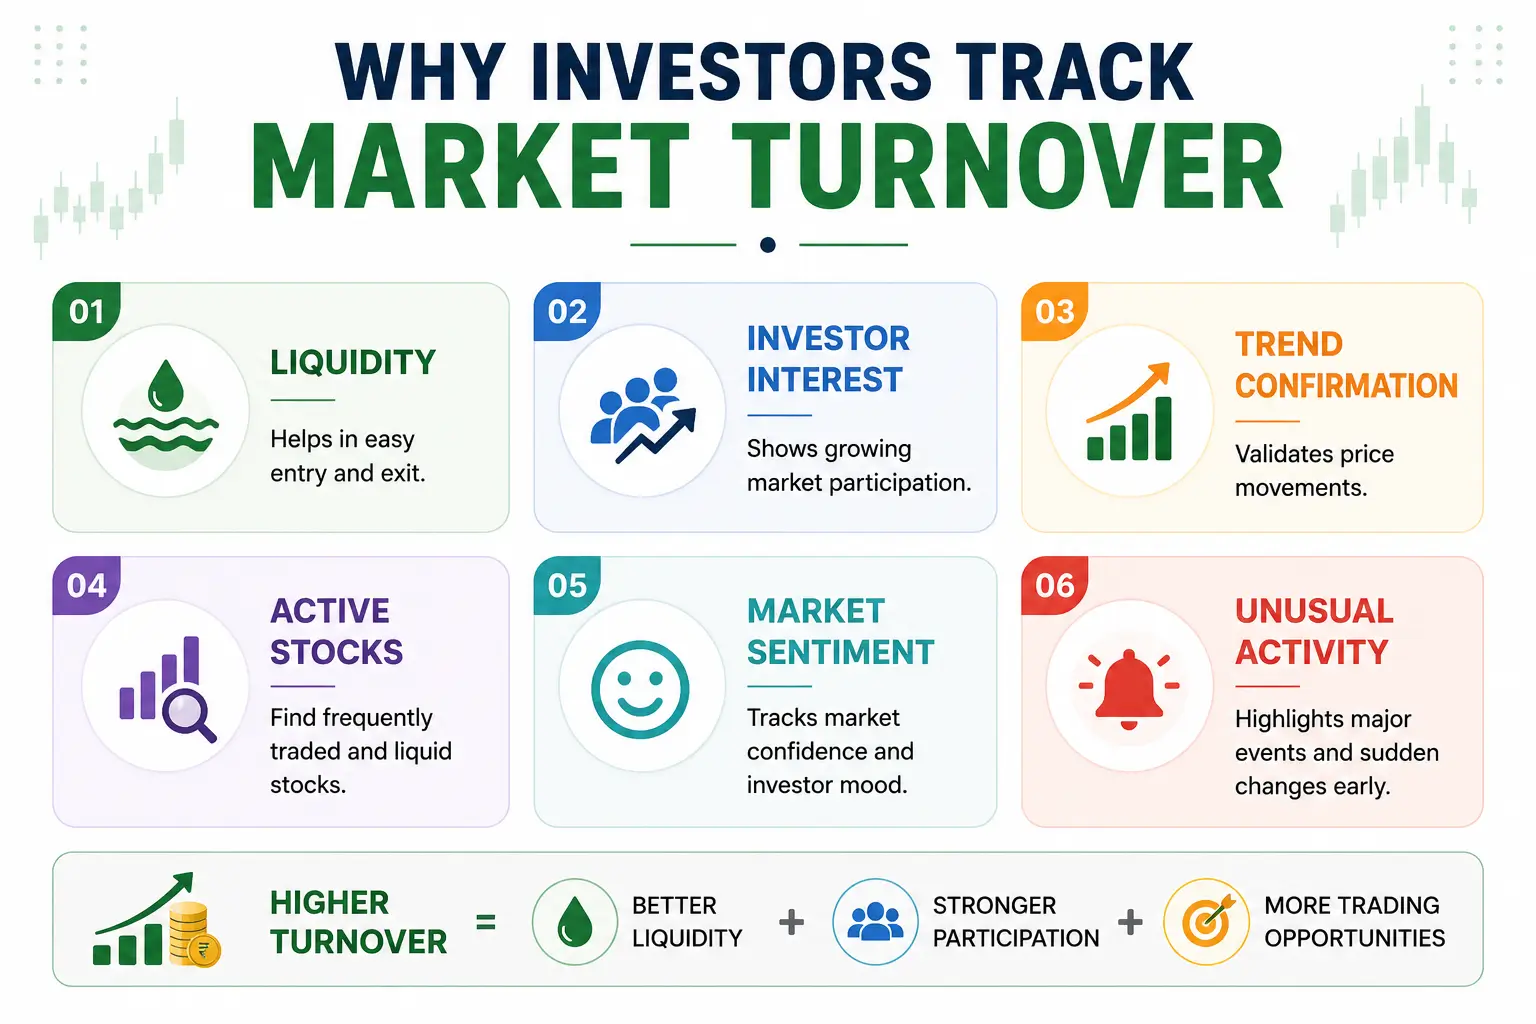
1. Measures Market Liquidity
One of the biggest uses of turnover analysis is measuring liquidity. The stocks with high buy and sell rates are the ones with high liquidity and demand as well. Knowing these will help you set your entry and exit positions well and ensure that trades are better.
2. Identifies Investor Interest
A rise in turnover often indicates growing interest in a stock or the broader market. This can be due to the increase in the number of retail or institutional investors. This can be a sign of attraction and can help you direct you in the way of stocks with strong market standing.
3. Validates Market Trends
Turnover analysis is commonly used alongside price movements. A price increase supported by strong turnover is generally considered more reliable than a price rise occurring on low turnover.
4. Helps Find Actively Traded Stocks
Investors often prefer stocks with healthy turnover. This is mainly because these are stocks with better liquidity and smoother trade execution. These stocks are generally easier to buy and sell when needed.
5. Tracks Market Sentiment
Any change in the turnover is a sign of the market sentiment. When there is a rise in turnover, this means that the interest is positive. But if there is a fall, then it is a sign that the market might not be moving in a positive direction.
6. Highlights Unusual Market Activity
A sudden spike in turnover can indicate significant events. This can be temporary due to some announcement, but it can again give you a direction to plan ahead. By checking such spikes, you can ensure that your trades are done well.
Conclusion
Market turnover helps investors understand how actively a stock or the overall market is being traded. A higher turnover is a sign of good interest and market liquidity. This can be a signal to invest as well. But a fall can be a sign of restricted activity, which is a sign to exit or hold.
But when you are planning to invest and trade, you would need support from experts. This is where you can open a demat account with Rupeezy and access stocks, IPOs, mutual funds, and more through a simple and user-friendly platform.
FAQs
1. What does stock turnover tell you?
Stock turnover tells you how actively a stock is being traded. If there is a high turnover, then it means there is good liquidity and investor interest as well.
2. Is a 15% turnover in a portfolio good?
A 15% portfolio turnover is low or moderate in nature. This is good for a long-term investment approach when the risk is low and trading costs are low.
3. What is a good turnover rate in stocks?
There is no fixed ideal turnover rate. But any stock with continued trading in the market and stable turnover is considered to be safe and good for trading.
4. Is higher turnover better or worse?
Higher turnover is usually better for liquidity and trading activity. But if it is very high, then this can be a sign of speculation, which is not good for the traders as well.
5. Can stock turnover predict growth?
No, stock turnover alone cannot predict growth. It only indicates trading activity. You would need to complete other analyses as well when you are planning to invest.
The content on this blog is for educational purposes only and should not be considered investment advice. While we strive for accuracy, some information may contain errors or delays in updates.
Mentions of stocks or investment products are solely for informational purposes and do not constitute recommendations. Investors should conduct their own research before making any decisions.
Investing in financial markets are subject to market risks, and past performance does not guarantee future results. It is advisable to consult a qualified financial professional, review official documents, and verify information independently before making investment decisions.
Investments in securities market are subject to market risks, read all the related documents carefully before investing . Rupeezy (SEBI RA Registration: INH000013332) provides this content for informational purposes; any securities quoted are for educational display and not as a recommendation. All charts and graphs are based on independent research and reliable sources for the period mentioned within the specific data set. Sometimes we take graphs from external sources. This communication does not promise or assure any fixed, guaranteed, or indicative returns to any client. For our complete registered office address, Member ID, and full SEBI registration details, please refer to our official website.

Open Rupeezy account now. It is free and 100% secure.
Start Stock Investment


All Category