Spinning Top Candlestick Pattern - Meaning, Examples, Tips
Spinning Top Candlestick Pattern - Meaning, Examples, Tips
by Aaron Vas
Aaron Vas is a Research Analyst at Rupeezy with over two years of experience in the finance industry. He holds an M.Com. degree in Finance from St. Aloysius College. Aaron is passionate about options trading and brings in-depth expertise in stocks, technical analysis, futures and options, mutual funds, and ETFs.
Last Updated: 24 March, 20267 min read
00:00 / 00:00
Since the inception of candlesticks over a century ago, various candlestick patterns have been discovered that help you spot bullish and bearish signals in the market. But few candlestick patterns are neutral in nature and they neither indicate bullishness nor bearishness in the stocks. One such pattern is the spinning top candlestick pattern. In this article, we will understand the spinning top candlestick pattern, what the spinning top indicates, and also understand ways to trade this pattern.
The Spinning top candlestick is a neutral pattern that indicates indecision in the market. This pattern can appear in a prevailing uptrend or downtrend and suggests a pause in the prevailing trend in security. After the appearance of this pattern, the security can either reverse from the direction of the existing trend or continue to move in the direction of the existing trend.
What is a Spinning Top Candle and How is it Formed?
The spinning top candle comprises a small body that is positioned between a large upper and lower wick. The closing price in this candlestick pattern typically closes near the opening price during the session.
The spinning top candlestick pattern starts with huge price fluctuations wherein the buyers are trying to push the price higher and the sellers are trying to push the price lower. This battle between the buyers and the sellers causes the huge upper and lower wick of the pattern. However, at the end of the session, the price of the security closes near the price where the security had opened which results in the small body of the Spinning top candlestick. This pattern suggests that neither the buyers nor the sellers were able to gain control of the security during the session.
Types of Spinning Top Candles
As you may have noticed, we haven't specified the color of the candle body for the Spinning Top Candlestick pattern. The simple reason behind this is that the body of the Spinning Top Candlestick Pattern can be either red or green in color. Hence, this pattern can be broadly classified into the following:
1) Red Spinning Top Candlestick
In the red spinning top candlestick, the body of the pattern is red because the closing price is lower than the opening price during the session suggesting a slightly higher selling pressure than the buying pressure.
2) Green Spinning Top Candlestick
In the green spinning top candlestick, the body of the pattern is green because the closing price is higher than the opening price during the session suggesting a slightly higher buying pressure than the selling pressure.
How to Identify a Spinning Top Candlestick Pattern?
The following are the key points to remember to identify the Spinning Top Candlestick pattern:
Location: This pattern can appear during any trend. If the Spinning Top Candle appears during a downtrend, it can indicate a potential bullish reversal. If the pattern appears during an uptrend, it can indicate a potential bearish reversal
Shape: The Spinning Top Candlestick pattern should have a small body and large upper and lower wicks
Color: The body of the spinning top pattern can be red or green. Here, the green body indicates that the prices have closed higher and the red body in the pattern indicates that prices have closed lower during the session
How to Trade the Spinning Top Candlestick Pattern?
As discussed above, a spinning top is a neutral candlestick pattern that can indicate equal buying and selling pressure in the security. Thus, one can use this candlestick pattern for both a bullish reversalas well as a bearish reversal in the security. Let us now discuss the ways one can enter long and short positions in security with examples.
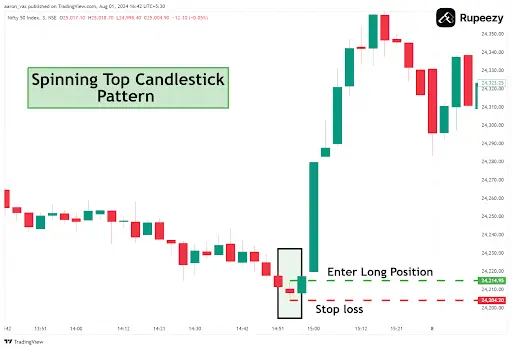
Spinning Top Candlestick Example -Trading Long Position
Spinning top candle formation in Nifty50 (Timeframe - 3 min)
Entry: If a spinning top candlestick pattern appears after the formation of a downtrend, one can consider entering a long position in the security.
When the price of the security crosses above the high of the spinning stop pattern, it suggests that the buyers were able to overcome the selling pressure in the market. Thus you can enter a long position above the high of the spinning top pattern as shown in the image.
Stop Loss: As the low of the spinning top pattern indicates the price where the sellers were rejected, it is considered the ideal point of stop loss in security. If you want to know how to use stop-loss check out our article on types of orders in stock market
Profit Target: As the spinning top is just a single candlestick pattern, its profit target can be based on the immediate resistance level, trailing stop loss method, or risk-to-reward ratio
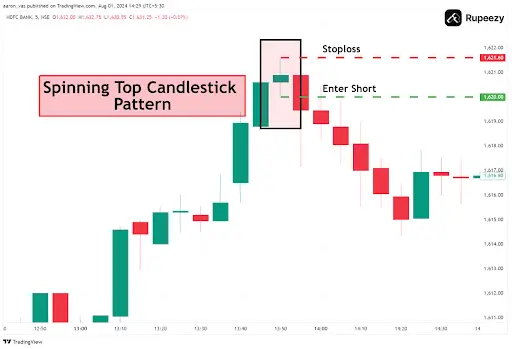
Spinning Top Candlestick Example - Trading Short Position
Spinning top candle formation in HDFC Bank (Timeframe - 5 min)
Entry: If a spinning top candlestick pattern appears after the formation of an uptrend, one can consider entering a short position in the security.
When the price of the security crosses below the low of the spinning stop pattern, it suggests that the sellers were able to overcome the buying pressure in the market. Thus you can enter a short position below the low of the spinning top pattern as shown in the image.
Stop Loss: As the high of the spinning top pattern indicates the price where the buyers were rejected, it is considered the ideal point of stop loss in security.
Profit Target: As the spinning top is just a single candlestick pattern, its profit target can be based on the immediate support level, trailing stop loss method, or risk-to-reward ratio
Continuations in the Spinning Top Pattern
While a spinning top candlestick pattern after an uptrend or downtrend can be used for reversal trading, it is important to note that the reversals will only occur if there is a weakness in the overall sentiment of the trend.
If the ongoing is strong, the security will likely continue in the prior direction after the appearance of the spinning top pattern. Thus it is always advisable to use the spinning top candle pattern in conjunction with other technical tools in order to get better trading signals.
Following are examples where the prior trend has continued after the appearance of the spinning top pattern:
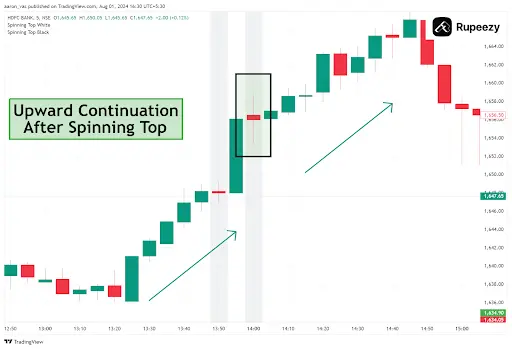
Example of Upward continuation
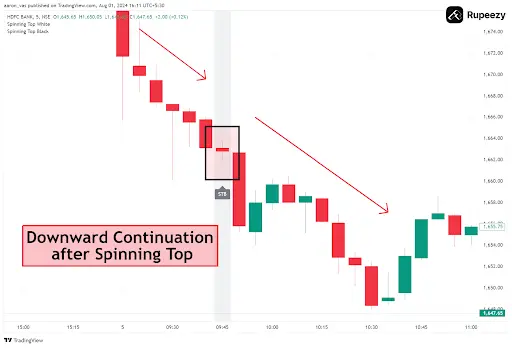
Upward continuation after spinning top candle formation in HDFC BankExample of Downward continuation
Downward continuation after spinning top candle formation in HDFC Bank
Limitations of Spinning Top Candlestick Pattern
Lack of Directional Bias: As the spinning top pattern suggests equal pressure from the buyers and the sellers, it does not give you a clear signal about the direction of the security
Requires additional confirmation: As the spinning top is a single candlestick pattern, validation from the next candle is required for any potential signals. Learn how to predict next candlestick to improve your chances
No Profit Targets: As the spinning top is a single candlestick pattern, it does not provide levels where traders would need to book profits in a trade
Frequent Appearance: The spinning top pattern appears quite frequently in the security. Thus, it cannot be relied solely on to enter any trading positions
Both the spinning top and the doji pattern indicate indecision between the buyers and sellers in the market and the appearance of both of these patterns at the end of any trend signals a potential reversal in security. However, the spinning top pattern and the doji pattern have the following differences:
Features
Spinning top
Doji
Body
A small body that can be red or green
A very small body is virtually non-existent
Wicks
Typically consists of long upper and lower wick
The size of the wicks can vary
Market Sentiment
Indicates indecision although there is some bias in the security
Strong indecision showing equilibrium between the buyers and sellers
Conclusion
We have reached the end of the article on the Spinning Top Candlestick Pattern. Before we wind up, it is important to note that the spinning top Pattern is a neutral pattern, it does not always guarantee a bullish or a bearish reversal. Thus, you should always use the spinning top candlestick pattern along with the combination of other technical indicators. You can utilize a range of technical indicators and take advantage of features such as trailing stop loss and margin trading on our Rupeezy trading app. Open Demat account on Rupeezy today and earn a 20% commission on every trade made by referring your friends and family.
The content on this blog is for educational purposes only and should not be considered investment advice. While we strive for accuracy, some information may contain errors or delays in updates.
Mentions of stocks or investment products are solely for informational purposes and do not constitute recommendations. Investors should conduct their own research before making any decisions.
Investing in financial markets are subject to market risks, and past performance does not guarantee future results. It is advisable to consult a qualified financial professional, review official documents, and verify information independently before making investment decisions.
Want to invest in stocks?
Open Rupeezy account now. It is free and 100% secure.