How to Predict Next Candlestick to Identify Market Trends

00:00 / 00:00
Here’s our complete guide to candlesticks and how they are used to predict bull and bear trends in the markets. We’ve decoded a range of bullish and bearish patterns to detect market movements.
Candlesticks were first used in Japan over 300 years ago to track the supply and demand of rice. Later, they were introduced to the stock market to represent price movements using various colors.
Did you know that market sentiments can be detected by reading these candlestick patterns? If you don't, let’s learn how to predict next candlestick pattern to understand the mood of the market.

What Are Candlestick Charts?
A candlestick is a price chart representing data from many timeframes in a single price bar.
The patterns generated by these candlestick patterns, over time, can aid traders in identifying crucial support and resistance levels as well as making proper forecasts regarding future price movements. The insights generated from these patterns help every trader, whether involved in intraday Trading or positional trading
In this article, we’ll talk about bull market and bear market predictions using candlestick patterns.
Bull Market Predictions
Bullish candlestick patterns may indicate a trend change from down to up. Traders use them to make educated judgments about initiating a long position. Here are some examples of candlestick patterns:
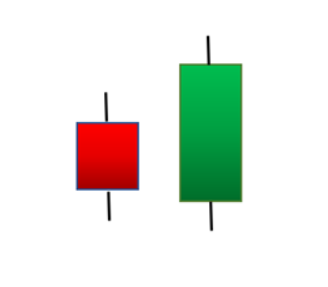
1. Bullish Engulfing Pattern
A bullish engulfing pattern is formed when there are more buyers in the market than the number of sellers. The bigger, green candlestick engulfs (covers) the smaller red candlestick in this pattern.
2. Hammer Candlestick
A hammer candlestick pattern consists of a small body on the top and a long wick at the bottom of the candlestick.
A hammer is formed at the end of the downtrend. This candlestick indicates that the sellers have had selling pressure, but buyers won the game by pushing the price upwards. After the formation of the hammer, the next candlestick could be a green candle.

3. Inverted Hammer
The inverted hammer candlestick pattern is identical to the last one, except the upper wick is longer. It’s assumed that sellers attempted to seize control even though there was purchasing pressure, but they were unsuccessful in driving the price down.
As a result, buyers are expected to reclaim market control soon.
Bear Market Predictions
In contrast to the bullish candlesticks, bearish candlestick patterns indicate a reversal from an uptrend toward the downside.
They are commonly used to detect resistance levels and as a signal to begin a short position. Here are some examples of these patterns:
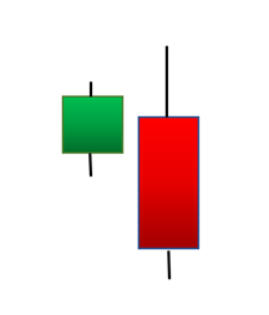
1. Bearish Engulfing Pattern
A bearish engulfing pattern is formed when a short, green candle is followed and consumed by a lengthy red-body candle near the end of an upward trend.
It suggests a halt in price movement and a possible market decline. The lower the engulfing candle, the more likely a negative trend is on the horizon.
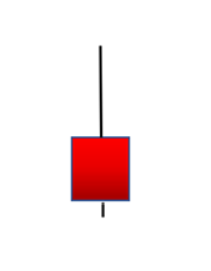
2. Shooting Star
The shooting star candlestick pattern, which looks like an inverted hammer, is frequently generated in a bearish market. It has a tiny body and a long top wick.
The pattern appears when the close price is only slightly lower than the open price, despite the price rallying during the session. It nearly appears to be a shooting star plummeting to Earth.
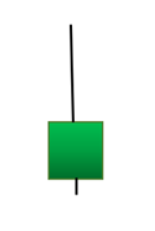
3. Hanging Man
The hanging man is a bearish market hammer. It comes after an upswing and marks the beginning of a decline.
The below diagram shows that the buyers gave a tough fight to push the market upward.
But at the end of that candle time frame, the sellers managed to defeat the buyers the made the candle close in the red.

Conclusion
So, now you know how candlestick patterns can predict market movements. It might sound like magic, but it’s all about being observant and keeping a close watch on the market. Candlesticks simplify a trader’s life by revealing market sentiment at a glance. Earning money was never easy, but with these indicators, you can get closer to your goals!
Now that you are confident in your market predictions, open demat account with Rupeezy to start your stock market journey.
The content on this blog is for educational purposes only and should not be considered investment advice. While we strive for accuracy, some information may contain errors or delays in updates.
Mentions of stocks or investment products are solely for informational purposes and do not constitute recommendations. Investors should conduct their own research before making any decisions.
Investing in financial markets are subject to market risks, and past performance does not guarantee future results. It is advisable to consult a qualified financial professional, review official documents, and verify information independently before making investment decisions.

Open Rupeezy account now. It is free and 100% secure.
Start Stock Investment


All Category