Bullish Harami Pattern - Meaning, Examples, Trading Tips

00:00 / 00:00
Traders utilize a variety of tools to identify trading opportunities in the market. Among the various tools, one of the widely used approaches is the analysis of candlestick patterns. The bullish harami pattern is one among the various candlesticks that can guide your trading strategy. In this article, we will explore the meaning of bullish harami candlestick pattern, its interpretation, potential trading opportunities, and more.

What is a Bullish Harami Pattern?
A Bullish harami candlestick is a two-candlestick pattern that indicates a shift from bullish to bearish sentiment in a stock. It is a reversal pattern that is is primarily used after its appearance in a downtrend.
This candlestick pattern comprises a large red candle followed by a green candle that forms within the body of the prior candle as marked in the image below. Here, the word ‘harami’ is derived from the Japanese word which means ‘Pregnant”, as the pattern comprises a small candle within a prior large candle.
How to Identify a Bullish Harami Candlestick Pattern
One should look for the following criteria in order to use a bullish harami candlestick for bullish reversal:
Prior Trend: As the bullish harami candlestick is used for bullish reversal, the appearance of this pattern after a downtrend provides an ideal scenario for trading it.
First candle: The first candle in the bullish harami pattern is a large bearish (red) candle which indicates a strong selling pressure in the security.
Second Candle: The second candle in the pattern is a bullish (green) candle that opens and closes within the body of the prior red candle
Wicks: The wicks of the candlesticks are not a crucial part of the bullish harami pattern. It is only sufficient if the body of the green candle is contained within the body of the red candle.
Psychology of the Bullish Harami Pattern
Let us now understand the psychology of the Bullish Harami Candlestick Pattern in the context of its appearance after a downtrend.
The red candle in the harami pattern indicates that the sellers have a dominant position in the security and are pushing the price lower. However, a smaller green candle appears after the formation within the body of the prior red candle. This suggests that the selling pressure is weakening and the buyers are beginning to enter the security and a reversal may likely occur.

How to Trade a Bullish Harami Candlestick Pattern?
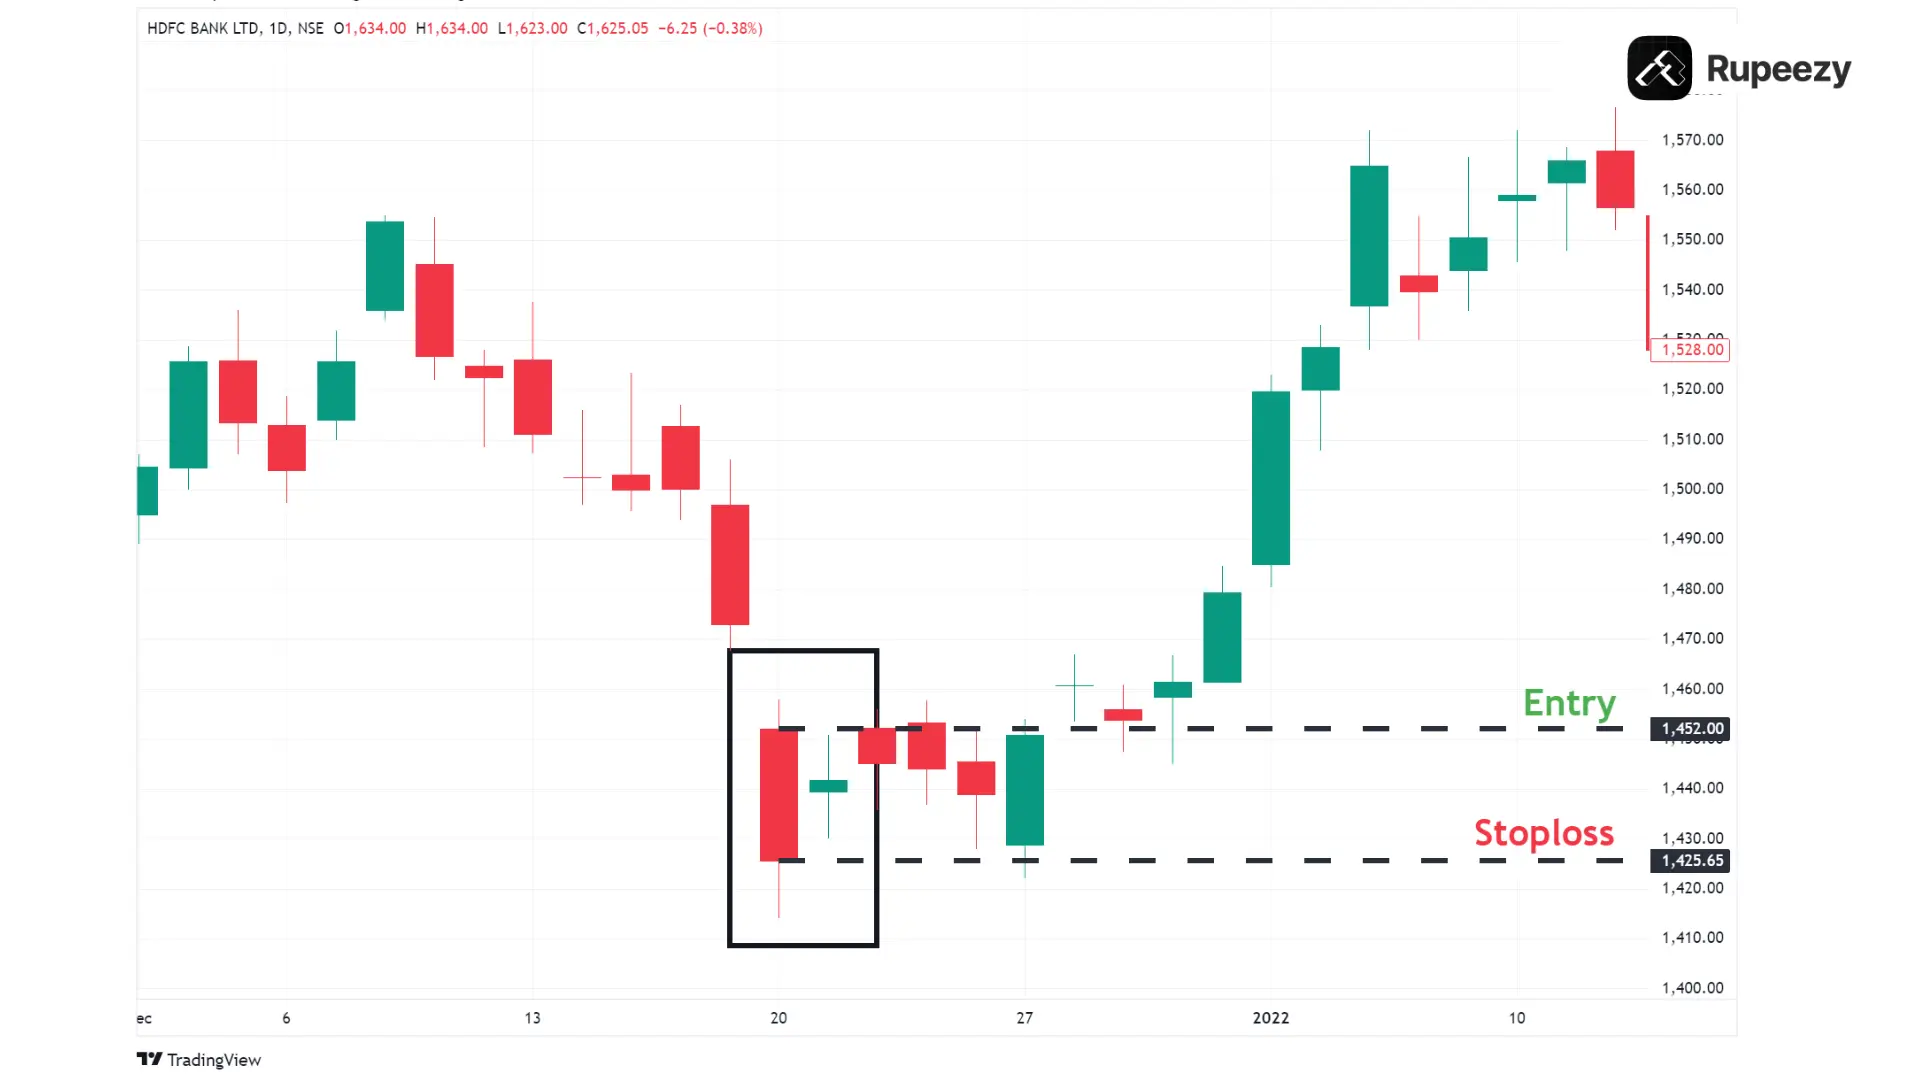
When a Bullish harami Pattern appears after a downtrend, one can look to enter a long position in the stocks which is explained using a live example below:
Bullish Harami Pattern Example
Bullish Harami Entry: When the price of the security starts trading above the opening price of the red candle, one can look to enter a long position in the security.
Stop Loss: If the price of the security starts trading below the closing price of the red candle, it suggests that the buyers have failed to overthrow the sellers in the security. Thus one can place a stop loss at the opening price of the red candle.
Profit Target: The profit target for the bullish harami pattern can be based on the risk-to-reward ratio, trailing stop loss method or the immediate resistance level.
How Accurate is the Bullish Harami Pattern
Although the bullish harami candlestick pattern indicates a bullish reversal pattern, it will not work 100% of the time. Its accuracy for reversal can vary based on the following factors:
Market Conditions: There should be signs of the bearish trend weakening for the bullish harami pattern to have better chances of bullish reversal. In a strong downtrend, the security might continue to move downward with the appearance of a harami pattern, or the reversal may be very short.
Time Frame: The appearance of the harami pattern in a longer timeframe like the daily or weakly charts is more reliable than in the shorter timeframes. Furthermore, the bullish harami pattern tends to be suitable for temporary reversals rather than long-term reversals.
Bullish Harami and Bearish Harami - Key Differences
Basis | Bullish harami | Bearish harami |
Composition | A green candle that forms within the prior red candle | A red candle that forms within the prior green candle |
Formation | Forms at the end of a downtrend | Forms at the end of an uptrend |
Psychology | Suggests the weakening of the selling pressure and potential shift to bullish sentiment | Suggests the weakening of the buying pressure and potential shift to bearish sentiment |
Significance | Signals a potential bullish reversal | Signals a potential bearish reversal |
Limitations of the Bullish Harami Candlestick Pattern
Short-Term Focus: The Bullish Harami pattern generally signals minor reversals and may not be suitable for long-term trends.
Weak Reversal: As the body of the green candle is formed within the body of the prior red candle, it is a relatively weaker reversal pattern compared to the bullish engulfing pattern.
Dependency on Overall Trend: The reliability of the bullish harami pattern can vary a lot depending on the market condition. For instance, the appearance of the bullish harami pattern in a strong downtrend wouldn't be sufficient for security to reverse.
Conclusion
We have reached the end of the article on the bullish harami candlestick pattern. Before winding up, it is important to note that the bullish harami pattern does not guarantee a reversal which is why it is important to use this pattern along with a combination of other technical tools and indicators and also place proper risk management strategies to mitigate huge losses.
You can utilize a range of technical indicators and take advantage of features such as trailing stop loss on our Rupeezy trading app. Open Demat account with Rupeezy today and earn a 20% commission on every trade made by referring your friends and family.
Check Out These Related Articles |
4 Bullish Reversal Patterns That All the Traders Should Know |
The content on this blog is for educational purposes only and should not be considered investment advice. While we strive for accuracy, some information may contain errors or delays in updates.
Mentions of stocks or investment products are solely for informational purposes and do not constitute recommendations. Investors should conduct their own research before making any decisions.
Investing in financial markets are subject to market risks, and past performance does not guarantee future results. It is advisable to consult a qualified financial professional, review official documents, and verify information independently before making investment decisions.

Open Rupeezy account now. It is free and 100% secure.
Start Stock Investment


All Category