Morning Star Pattern - Meaning, Examples, How to Trade

00:00 / 00:00
While trading in the financial markets, being able to spot the reversals in the early stages can help in getting lucrative returns. Among the various tools, the Morning Star Candlestick Pattern is one of the reliable tools that can help you spot reversals in the early stages. In this article, we will explore the meaning of the Morning Star pattern, its interpretation, potential trading opportunities, and more.

What is Morning Star Pattern?
A Morning star pattern is a three-candlestick pattern that indicates a shift from bearish to bullish sentiment in a stock. This appears at the end of a downtrend and indicates a potential reversal to the upside.
This candlestick pattern comprises a large red candle, a small-bodied candle (red or green), and a green candle followed by which a security may start trending upwards. Let us now understand how to identify the morning star pattern in detail.
How to Identify a Morning Star Candlestick Pattern
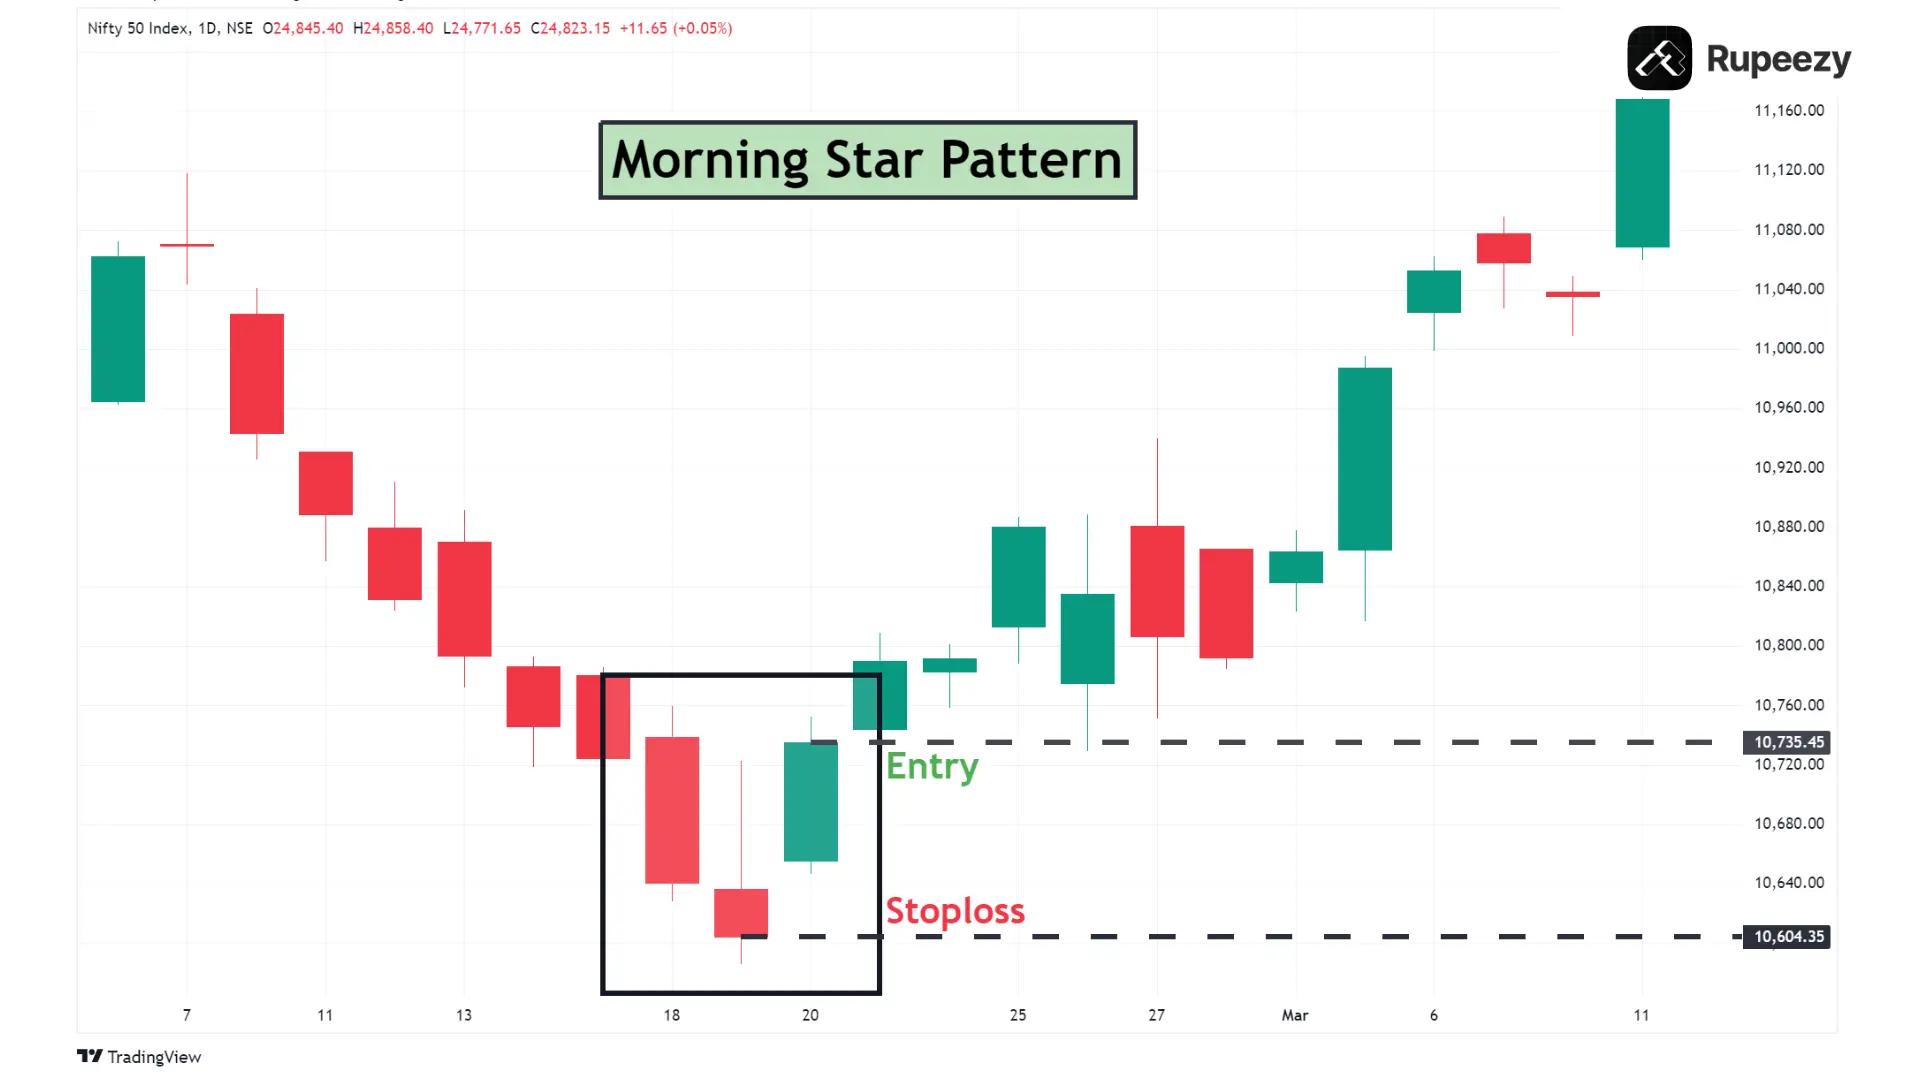
Below are the pointers to help you identify and confirm the Morning Star pattern. For better understanding, please refer to the marked areas in the image below:
Prior Trend: As the morning star pattern is a bullish reversal pattern, the pattern should appear after a significant downtrend.
First candle: A large red candle which indicates that the sellers are in control
Second candle: A small-bodied candle that can be either red or green. This candle opens below the body of the first candle and indicates an indecision in the market.
Third candle: A large green candle that opens above the second candle and closes above the midpoint of the first candle. The candle closing above the midpoint indicates the shift from bearish to bullish momentum in security.
What Does a Morning Star Pattern Indicate
The basic psychology behind the morning star pattern is the gradual shift in the market sentiment from bearish to bullish.
In a downtrend, the first red candle in the morning star pattern suggests that the sellers have a strong on the security and are pushing the price lower. However, the next candle in the pattern that opens below the red candle closes with a small body. This suggests that the sellers are losing momentum and there is an indecision between the buyers and sellers in the security.
Finally, a green candle appears that opens above the second candle and closes above the midpoint of the first candle. This indicates that the buyers were able to overcome the selling pressure in the market and the security might start moving in an uptrend.

How to Trade a Morning Star Candlestick Pattern
When a Morning Star Pattern appears after a downtrend, one can look to enter a long position in the stocks which is explained using a live example below:
Morning Star Pattern Entry: When the price of the security starts trading above the closing price of the third candle in the morning star pattern, one can enter a long position in the security
Stoploss: As the second candle of the morning star pattern indicates the indecision between the buyers and sellers, it should be considered as the trigger for stoploss.
If the second candle is bearish (red), its closing price is considered the trigger for stop loss for the trade. On the other hand, if the second candle is bullish(green), its opening price is considered the trigger for stop loss for the trade.
Profit Target: The profit target for the Morning Star pattern can be based on the immediate resistance levels, risk-to-reward ratio, or by trailing the stop loss as the price moves higher.
Rules for Morning Star Pattern
Following are the rules to be kept in mind while trading the morning star pattern:
Market Conditions: The main rule to consider while trading the morning star pattern is that it is more reliable when it forms after a strong downtrend, In a sideways market, this candlestick pattern may not give a big upside.
Time Frame: The morning star pattern is more reliable in a higher time frame (daily, weekly) compared to a lower timeframe. This can be attributed to the lower timeframes being more volatile while higher timeframe filters out the market noise.
Morning Star and Evening Star Pattern - Key Differences
Aspect | Morning Star Pattern | Evening Star Pattern |
Formation | Forms at the end of a downtrend | Forms at the end of an uptrend |
Composition | A large bearish candle followed by a small-bodied candle and then a large bullish candle | A large bullish candle followed by a small-bodied candle and then a large bearish candle |
Psychology | Signals that selling pressure is weakening, and buyers are gaining control | Signals that buying pressure is weakening, and sellers are gaining control |
Significance | Bullish reversal pattern | Bearish reversal pattern |
Best Used In | Downtrends | Uptrends |
Morning Star and Doji - Key Differences
Aspect | Morning Star Pattern | Evening Star Pattern |
Formation | Forms at the end of a downtrend | Can appear in any trend |
Composition | A large bearish candle followed by a small-bodied candle and then a large bullish candle | A single candlestick with a non-existent body |
Psychology | Signals that selling pressure is weakening, and buyers are gaining control | Signals an indecision between the buyers and sellers |
Significance | Bullish reversal pattern | Can be used for potential reversal as well as continuation |
Reliability | More reliable in higher time frames | Reliability depends on the overall context of the market |
Advantages of the Morning Star Pattern
Reliable Reversal Signal: The Morning Star pattern is one of the more reliable bullish reversal patterns compared to others, especially when it forms after a significant downtrend.
Clear Indication: The formation of the morning star pattern indicates the change in the market sentiment from bearish to bullish.
Works on Multiple Time Frames: The Morning Star pattern can be used to trade in different timeframes. Although, it is more reliable on a longer timeframe.
Disadvantages of the Morning Star Pattern
Short-Term Focus: The Morning star pattern generally signals shorter reversals and does not guarantee a long-term upside.
Dependency on Overall Trend: The reliability of the Morning Star pattern can vary a lot depending on the market condition. This pattern is more reliable in a well-defined downtrend and can lead to false signals in a less clear trend.
Conclusion
We have reached the end of the article on the morning star candlestick pattern. Before winding up, it is important to note that while it is a reliable candlestick pattern, it is preferable to use it in higher timeframes. Furthermore, the morning pattern should be used with a combination of other technical indicators to get the best results.
You can utilize a range of technical indicators and take advantage of features such as trailing stop loss on our Rupeezy trading app. Open Demat account with Rupeezy today and earn a 20% commission on every trade made by referring your friends and family.
Check Out These Related Articles |
4 Bullish Reversal Patterns That All the Traders Should Know |
The content on this blog is for educational purposes only and should not be considered investment advice. While we strive for accuracy, some information may contain errors or delays in updates.
Mentions of stocks or investment products are solely for informational purposes and do not constitute recommendations. Investors should conduct their own research before making any decisions.
Investing in financial markets are subject to market risks, and past performance does not guarantee future results. It is advisable to consult a qualified financial professional, review official documents, and verify information independently before making investment decisions.

Open Rupeezy account now. It is free and 100% secure.
Start Stock Investment


All Category