What is the W Pattern - Meaning, Components, How to Trade

00:00 / 00:00
Spotting trend reversals early can be a powerful way to catch big market moves before they gain momentum. One such reliable reversal indicator is the W pattern in stock market, also known as the double bottom. Formed after a downtrend, this pattern signals a potential bullish reversal, helping traders identify when a falling price may be about to turn upward.
In this article, we’ll explore the key components, psychology, trading strategy, and common mistakes related to the W pattern, which will help you to use it more effectively in your trading decisions.

What is the W Pattern?
The W pattern also known as the double bottom, is a reversal chart pattern formed after a downtrend. This W pattern chart consists of two price lows separated by a peak in the center. The formation of this pattern suggests a loss of downward momentum and a potential rise in the price of the security.
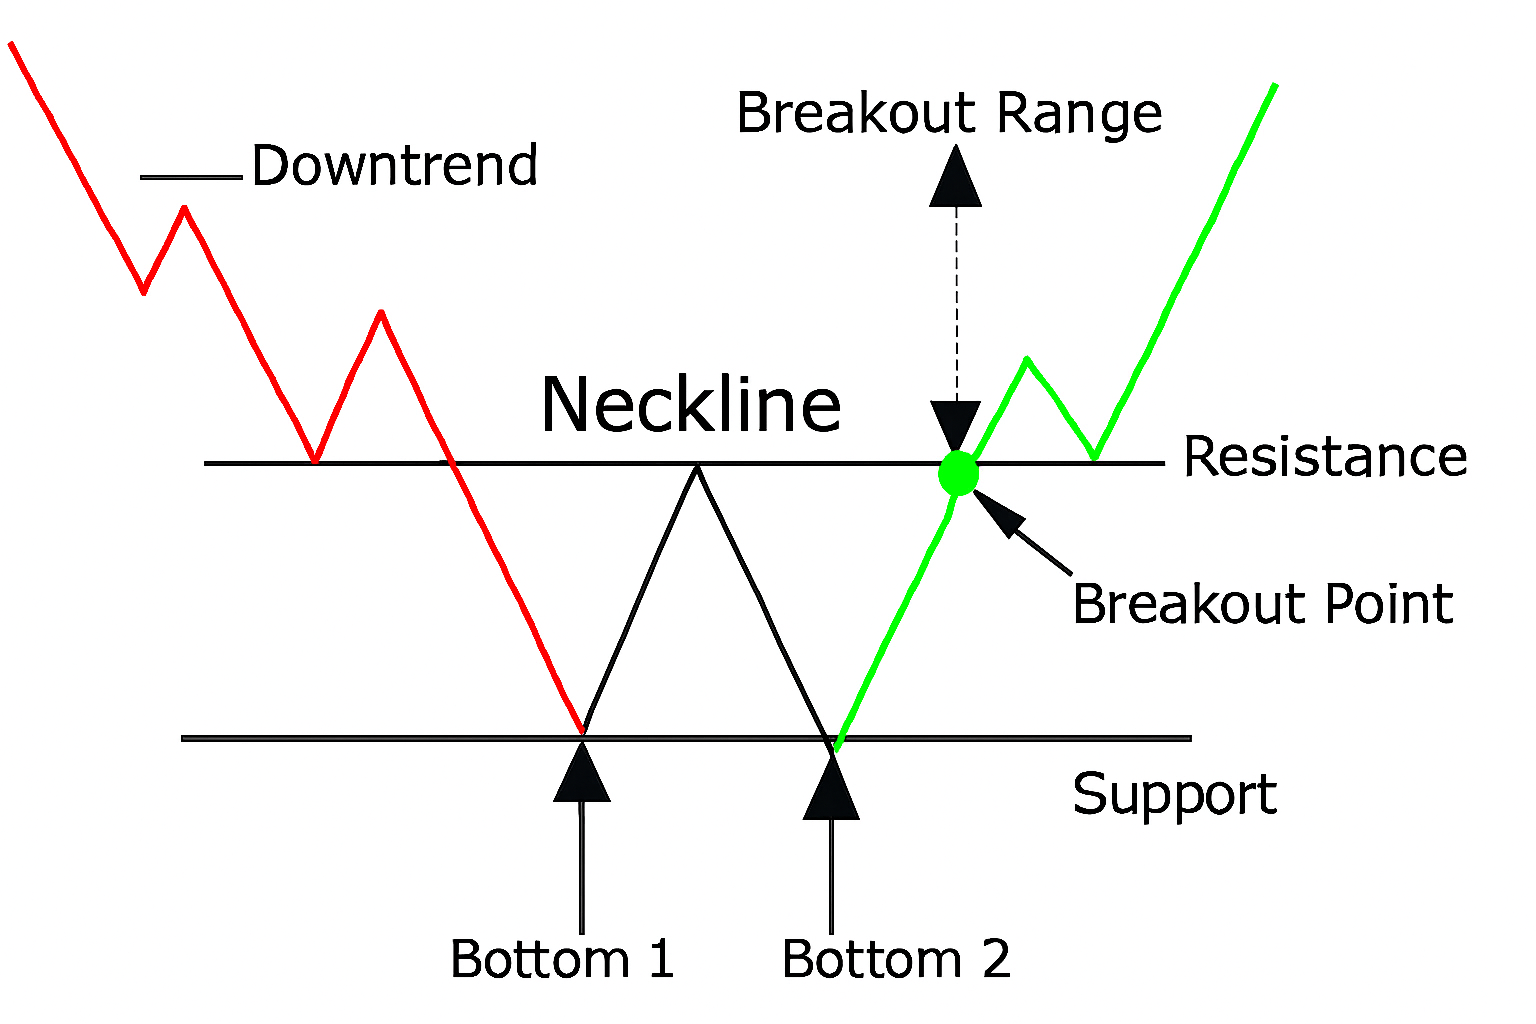
Screenshot explaining the W Pattern
Key Components of the W Pattern
To fully understand the W pattern, it is essential to break down its core components, each of which plays a crucial role in shaping this formation.
First low/trough
This is the first low of the pattern formed after a significant downtrend where sellers dominated the market. This reflects the slowing down of the selling pressure as the prices have declined significantly.
Center Peak
Following the first low, the price of the security increases a bit. However, this price increase faces some resistance as the sellers re-enter or there is some profit-booking in this temporary price increase. Here, the peak formed from the price increase becomes a crucial part of the chart pattern as it becomes the resistance/neckline of the pattern.
Second low/trough
Now, the price decline after the peak again halts or slows down and begins to move upward. This upward movement preferably should occur in the same range or above the first low. This suggests that selling pressure has weakened, and the buyers may begin to take control of the security.
W Pattern Breakout Point
As the price continues to increase from the second low, it faces a resistance formed near the center peak in the pattern. This is a crucial juncture for price reversal in the security. When the price breaks above this level, it confirms that the buyers have taken control and the security will likely move in the upward direction.
Volume Confirmation (Optional)
While not a strict requirement, volume plays a key role in confirming the pattern's reliability. During the breakout above the neckline, high or increasing volume indicates strong buying interest and adds confidence to the price reversal.
Psychology Behind the W Pattern
The W pattern reflects different stages of sentiment around a security. The first trough shows bearish exhaustion, where intense selling begins to weaken and some buyers start entering the security. As the price rebounds slightly, it hits a temporary resistance, showing uncertainty as neither buyers nor sellers are fully in control.
The second trough signals the failure of sellers to push the price lower again, indicating that bearish momentum is fading and buyers are gaining strength. Finally, when the price breaks above the resistance, it confirms a bullish takeover, signaling a likely reversal to an uptrend and giving traders more confidence to buy the security.

Trading using the W Pattern
Here are the steps to follow to use the W pattern in trading:
Identify and confirm the pattern:
To identify the W pattern, you will need to look for two price lows separated by a high in the center. Here, you should make sure that the second low does not fall below the first low and wait for the price to break above the center peak.
Enter Long Position
When the price of the security breaks above the center peaks which acts as resistance, it suggests that the buyers have taken control and the security will likely move upwards. At this point, you should consider entering a long position in the security.
It is even more reliable if this breakout is supported by an increase in trading volume, as this adds strength to the signal and confirms growing buyer interest in the security.
Stop loss
Once the price breaks above the resistance level, it turns into a support. If the price fails to hold above this level after a breakout and drops below it again, it may signal a failed pattern. In that case, long positions should be exited to limit potential losses.
Profit Target:
The profit target for the W pattern is typically calculated by measuring the distance between the lowest point of the pattern and the neckline (resistance level). Once the price reaches a level equal to this distance above the neckline, you can consider booking profits from your position.
Amplify W Pattern Opportunities with Margin Trading Facility
Traders who spot a reliable W pattern can enhance their market participation using the Margin Trading Facility (MTF). MTF allows you to take larger positions in stocks showing strong bullish reversals without deploying your entire capital. For example, once the W pattern confirms a breakout, leveraging MTF can help you maximize gains from the anticipated upward movement, while keeping some funds available for other trades. Remember, margin amplifies both profits and losses, so it should be used prudently in combination with risk management strategies like stop-loss.
Best Timeframes for the W Pattern
The W pattern can be used in any timeframe, from minutes to weeks, depending on the trader's style. However, it is more reliable on longer timeframes such as the daily chart or higher (like weekly), as these reduce market noise and offer clearer signals.
Longer timeframes also experience less volatility, making it easier to analyze volume and confirm breakouts more accurately. For better results, swing traders and position traders often prefer using the W pattern on 1-day or higher charts.
Common Mistakes in W Pattern Trading
Entering Too Early:
Many traders jump in before the neckline breaks, hoping for a reversal, only to see the price fail to hold its upward move. Entering too early increases the risk of getting caught in a false breakout.
Ignoring the Trend:
The W pattern typically forms after a downtrend, acting as a reversal signal. Trying to trade it during sideways or upward trends can lead to incorrect setups and losses.
Expecting Perfect Symmetry:
W patterns are rarely perfectly shaped and may appear uneven. It's more important to focus on the overall structure and trend reversal rather than expecting an exact mirror image.
Setting Stop-Loss Too Tight:
Placing the stop-loss too close to the second trough can make your trade vulnerable to normal price fluctuations. This often leads to getting stopped out too early, even if the pattern plays out.
M Pattern vs W Pattern
The following are the differences between the M and W patterns
Aspect | M Trading Pattern | W Trading Pattern |
Chart Shape | Resembles the letter M | Resembles the letter W |
Trend Signal | Indicates a bearish reversal, suggesting a potential downtrend | Indicates a bullish reversal, suggesting a potential uptrend |
Highs and Lows | Consists of two peaks and one trough | Consists of two troughs and one peak |
Second High or Low | The second peak is usually lower than the first | The second trough is usually higher than the first |
Market Pressure | Shows increasing selling pressure after the second peak | Shows increasing buying pressure after the second trough |
Confirmation Signal | Confirmed when the price falls below the midpoint trough | Confirmed when the price rises above the midpoint peak |
Conclusion
The W pattern is a powerful tool for identifying bullish reversals, especially after a strong downtrend. Its clear structure helps traders spot potential trend changes early, offering well-timed entry opportunities. When used correctly with patience, volume confirmation, and proper risk management, it can significantly improve trading outcomes.
FAQs
Q1: Is the W pattern bullish or bearish?
The W pattern is a bullish reversal pattern that forms after a downtrend and suggests a possible upward movement in price.
Q2: How does the W pattern entry and exit?
In the W pattern, enter the trade when the price breaks above the center peak (neckline), and exit when the price reaches the projected target or fails to hold above support.
Q3: What does the W pattern indicate?
The W pattern indicates that selling pressure is weakening and buyers are gaining control, signaling a potential trend reversal to the upside.
Q4: What is the difference between the M pattern and the W pattern?
The M pattern signals a bearish reversal with two highs, while the W pattern signals a bullish reversal with two lows. Both are mirror opposites in structure and direction.
Q5: What is the extended W pattern?
An extended W pattern is a larger or more drawn-out version of the standard W. It may have more complex price action, but still reflects a bullish reversal after a downtrend.
More articles you might find useful |
The content on this blog is for educational purposes only and should not be considered investment advice. While we strive for accuracy, some information may contain errors or delays in updates.
Mentions of stocks or investment products are solely for informational purposes and do not constitute recommendations. Investors should conduct their own research before making any decisions.
Investing in financial markets are subject to market risks, and past performance does not guarantee future results. It is advisable to consult a qualified financial professional, review official documents, and verify information independently before making investment decisions.

Open Rupeezy account now. It is free and 100% secure.
Start Stock Investment


All Category