Hammer Candlestick Pattern - Meaning and How to Trade

00:00 / 00:00
There are multiple tools at the disposal of the traders that they can use to spot trading opportunities in the market. Among these various tools, candlestick patterns are one of the oldest and most classic approaches that are still relevant to this day. Out of these various candlestick patterns, the hammer candlestick pattern is the simplest and most widely used pattern among the traders. In this article, we will understand the Hammer Candlestick Pattern, its Interpretation, trading opportunities, and more.

What is Hammer Candlestick Pattern?
A hammer candlestick pattern is a bullish candlestick pattern that comprises a small body, little to no upper wick, and a large lower wick which is at least twice as large as the body of the pattern. This is a reversal pattern that appears at the end of a downtrend.
In the hammer pattern, the color of the body can either be red or green. Although the color of the pattern is not very relevant, it is important to note that a green hammer candlestick indicates a more potent reversal than a red hammer candlestick due to its price closing being higher than the opening price during the session.
Formation and Interpretation of Hammer Patterns
As a Hammer Candlestick pattern is considered a bullish reversal pattern, it should be noted that before the formation of the pattern, a few red candles should be formed in the security that is pushing the price lower. However, one should note that a few green candles can also appear before this pattern as long as the downtrend is still intact.
The downtrend suggests that the sellers have a strong hold and are dominant over the buyers in the security. As the downtrend progresses, there will be one candle that is moving downwards and indicating that the selling pressure is still intact. However, during the session, the price is pushed back up by the buyers near its opening price. This suggests that the sellers may have lost control of the downtrend and a reversal may occur.
The formation of the next candle after the hammer pattern confirms the reversal in the security. That is, the next candle should close above the high of the hammer pattern. Furthermore, the next candle's close price should not exceed the low of the hammer pattern.
How to Identify a Hammer Candlestick Pattern?
The following are the key points to remember to identify the hammer candlestick pattern:
Location: For a candlestick pattern to be called a hammer pattern, it should only appear after a downtrend. If a similar candlestick pattern appears after an uptrend, then that pattern is considered to be a hanging man pattern.
Shape: The pattern should have a small body, a lower twice as large as its body, and little to no upper wick.
Color: The body of the hammer pattern can be red or green in color. However, a green-bodied hammer pattern indicates greater conviction for reversal as it indicates the price closed higher than the opening price during the session

How to Trade Hammer Candlestick Pattern?
As mentioned earlier, one should only trade using a hammer pattern if the prior trend before the pattern formation is a downtrend. Once this basic criterion is met, one can look to enter a long position in the stocks which is explained using a live example below
Hammer Pattern Example
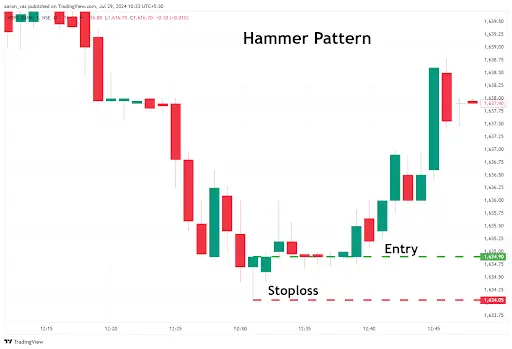
1) Entry
There are two ways to trade using this pattern. The first approach is you wait for the next candle after the hammer candlestick to close above it. Following this, one can enter a long position in security.
The second approach is an aggressive approach where you do not wait for the next candle to close above the hammer pattern. Here, you enter a long position as soon as the next candle starts trading above the hammer pattern.
2) Stop Loss
As the low of the hammer pattern indicates a price where the sellers were rejected, it is considered the ideal point of stop loss in the security.
If the security starts moving below the low price of the pattern, one can consider closing the long position in the trade.
3) Profit Target
Because the trade is based on a single candlestick pattern, there is no standard way to calculate the profit target. Profits can be booked using the risk-reward ratio, the immediate level, or even the trailing stop-loss strategy.
The best scenario for Hammer Pattern
As the hammer pattern indicates a bullish reversal, its probability of success is likely to increase as it appears near a well-established level of support.
This is because support zones are levels where a significant price action has occurred in the past. Therefore, this zone is perceived as a strong demand zone where the security might reverse in the upward direction.
Thus, the formation of the hammer pattern near a well-established support level creates confidence among the traders that the sellers are getting rejected near the demand and the price will likely reverse upwards.
Limitations of Hammer Candlestick Patterns
While the hammer candlestick pattern is a well-recognized candlestick used by traders, it does come with the following limitations:
Requires additional confirmation: As the Hammer pattern is a single candlestick pattern, validation from the next candle is required for any potential signals.
No Profit Targets: As the Hammer Candlestick is a single candlestick pattern, it does not provide levels where traders need to book profits in a trade.
Pullback: The appearance of this pattern during a downtrend can also suggest a minor retracement followed by this pattern continuing to move in the downward direction.
Hanging Man vs Hammer Candlestick - Key Differences
Both the Hammer candlestick pattern and the Hanging Man candlestick have a similar appearance. However, they have the following distinguishing features:
Features | Hanging Man Pattern | Hammer Pattern |
Prior trend | Appears after an uptrend | Appears after a downtrend |
Indication | Indicates a bearish reversal | Indicates a bullish reversal |
Best scenario | Preferrable to appear near a resistance level | Preferrable to appear near a support level |
Conclusion
We have reached the end of the article on the Hammer Candlestick Pattern. Before we wind up, it is important to note that the Hammer Candlestick Pattern does not guarantee a reversal, so it is important to use this pattern along with a combination of other technical tools and indicators and place proper risk management strategies to mitigate huge losses.
You can utilize a range of technical indicators and take advantage of features such as trailing stop loss on our Rupeezy trading app. Open Demat account with Rupeezy today and earn a 20% commission on every trade made by referring your friends and family.
Check Out These Related Articles |
The content on this blog is for educational purposes only and should not be considered investment advice. While we strive for accuracy, some information may contain errors or delays in updates.
Mentions of stocks or investment products are solely for informational purposes and do not constitute recommendations. Investors should conduct their own research before making any decisions.
Investing in financial markets are subject to market risks, and past performance does not guarantee future results. It is advisable to consult a qualified financial professional, review official documents, and verify information independently before making investment decisions.

Open Rupeezy account now. It is free and 100% secure.
Start Stock Investment


All Category