Best Indicators for Swing Trading and How to Use Them

00:00 / 00:00
Volume indicators, moving averages, and RSI are some of the best indicators for swing trading, helping you make smarter trading decisions. These indicators can help you spot high-probability trade setups and provide extra confirmation before you enter or exit a trade.
If you want to improve your timing and make more confident decisions in swing trading, the right indicators can make all the difference. In this article, we’ll walk you through the top swing trading indicators, explain how to use them effectively, and highlight their limitations. So let’s dive in!

What is Swing Trading?
As the name suggests, Swing trading is a form of trading where traders try to capture the swings in the prices of stocks, indices, and commodities. Here, capturing the swings means buying at a low price and selling high, or selling high and then buying at a lower price.
Depending on the type of security or the type of entry you place (buy or sell entry), one can execute a swing trade either by directly investing in the security or by entering a futures contract. Additionally, the duration of positions in swing trades can range from over a day to several weeks, depending on the total points you aim to capture in the security.
Why Indicators Matter in Swing Trading
Identifying the right entry point is vital in swing trading, especially when you're aiming to capture meaningful price moves. Although price action is a time-tested method for spotting these swings, it often requires experience and a keen understanding of market behavior.
However, if you’re new to price action or simply looking for a guide to improve your trades, indicators are one of the best tools available. They offer a structured approach to identifying potential setups and can add confidence to your trading decisions. Let us now explore a few key options to help you discover the best indicator for swing trading that suits your strategy and style.
List of Best Indicators for Swing Trading in India
S No. | Best technical indicators for swing trading |
1. | Volume Indicator |
2. | Moving Averages |
3. | Relative Strength Index |
4. | MACD Indicator |
5. | Fibonacci Retracement |

Overview of Top Swing Trading Indicators
Here’s a closer look at some of the most effective swing trading indicators and how to use them in a practical scenario to make smarter trading decisions.
1) Volume Indicator
Volume indicator measures the number of shares traded during each candle, and it offers crucial insight into the behavior of market participants. This indicator can be particularly useful in identifying huge buying activities, which can lead to a potential price increase in the security.
How to use it:
Suppose there is a huge increase in the green (buying) volume with no major price movements, it suggests that the big players are building their positions to go long(buy) in the security. Here, their goal would be to sell the security at a higher price than they entered. This gives you an opportunity to enter a long position in the security with the expectation that the big players will drive the price higher.
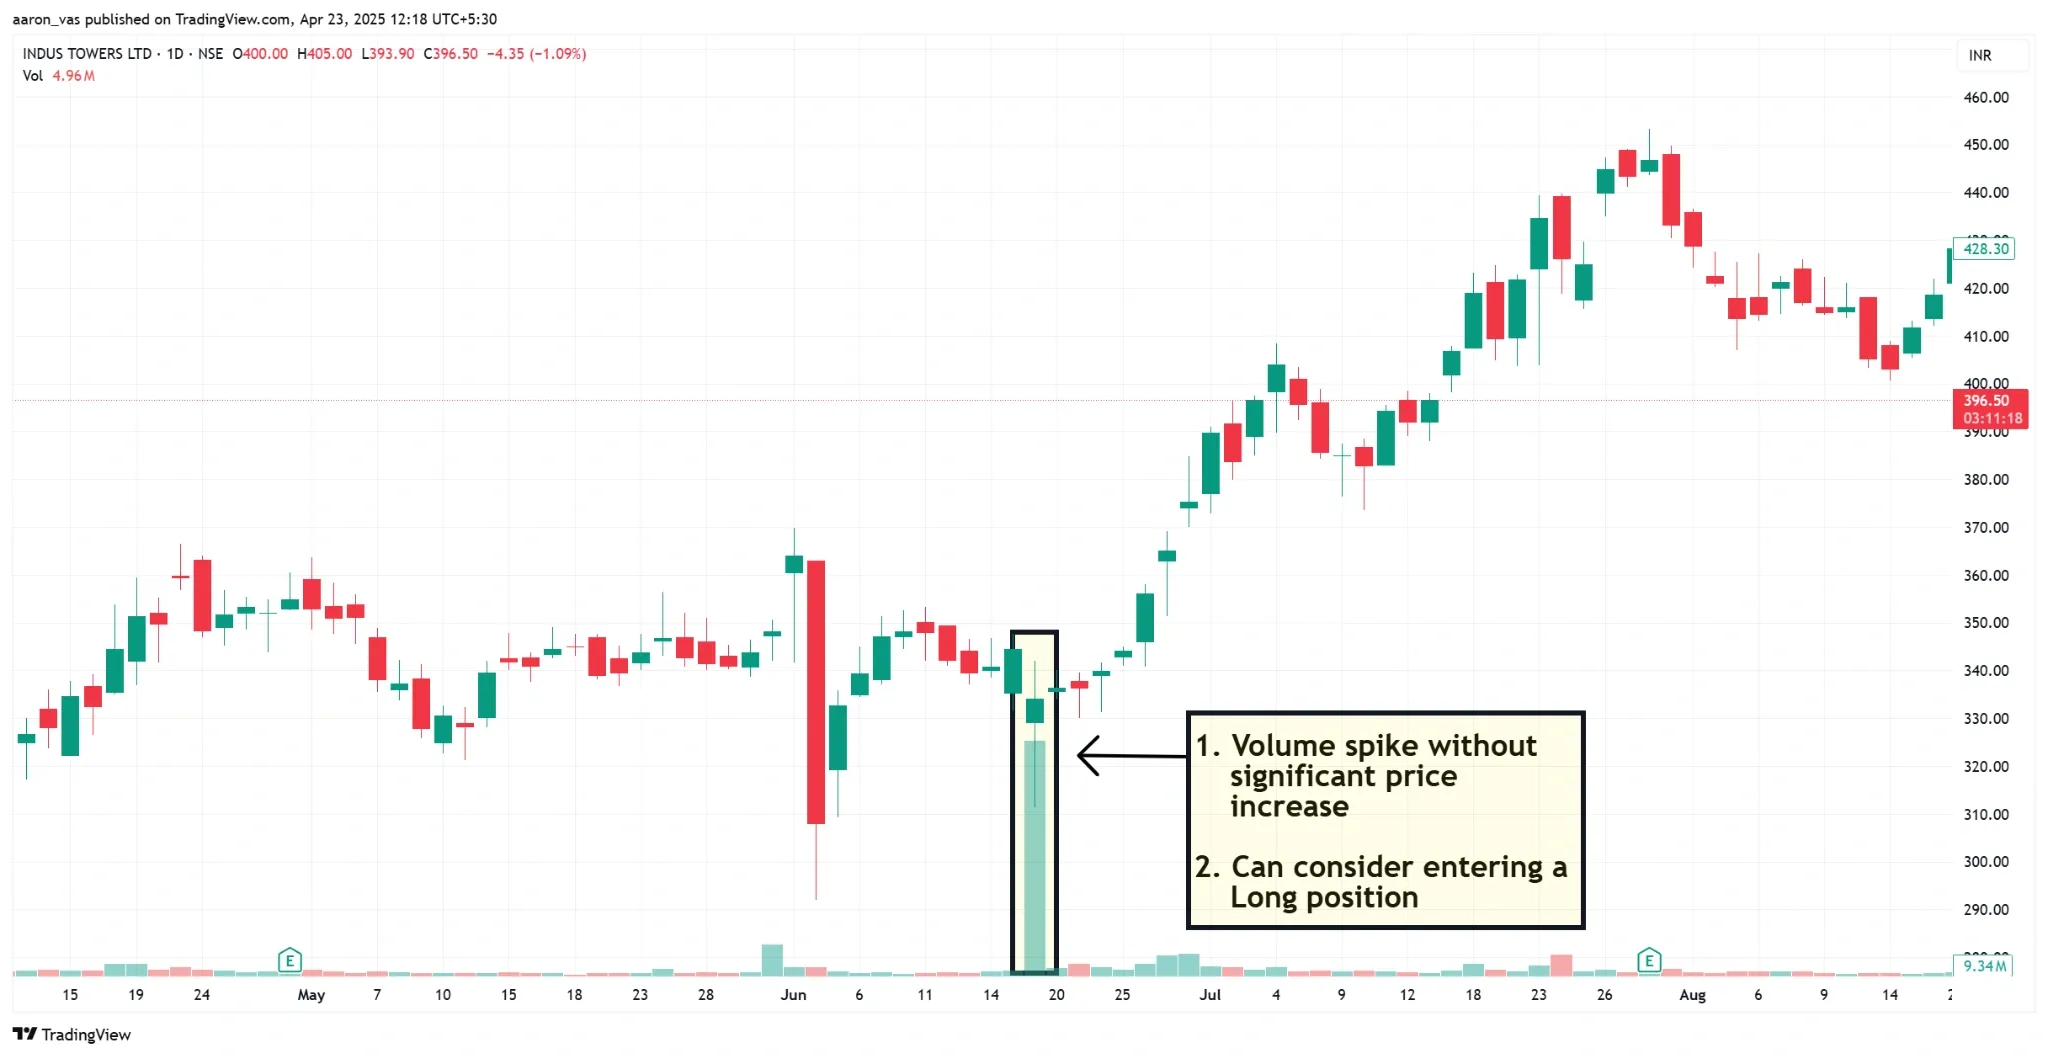
This indicator is well-suited for use on the daily timeframe, but proves to be even more effective on the weekly timeframe, where it provides a clearer view of underlying buying and selling activity.
2) Moving Averages
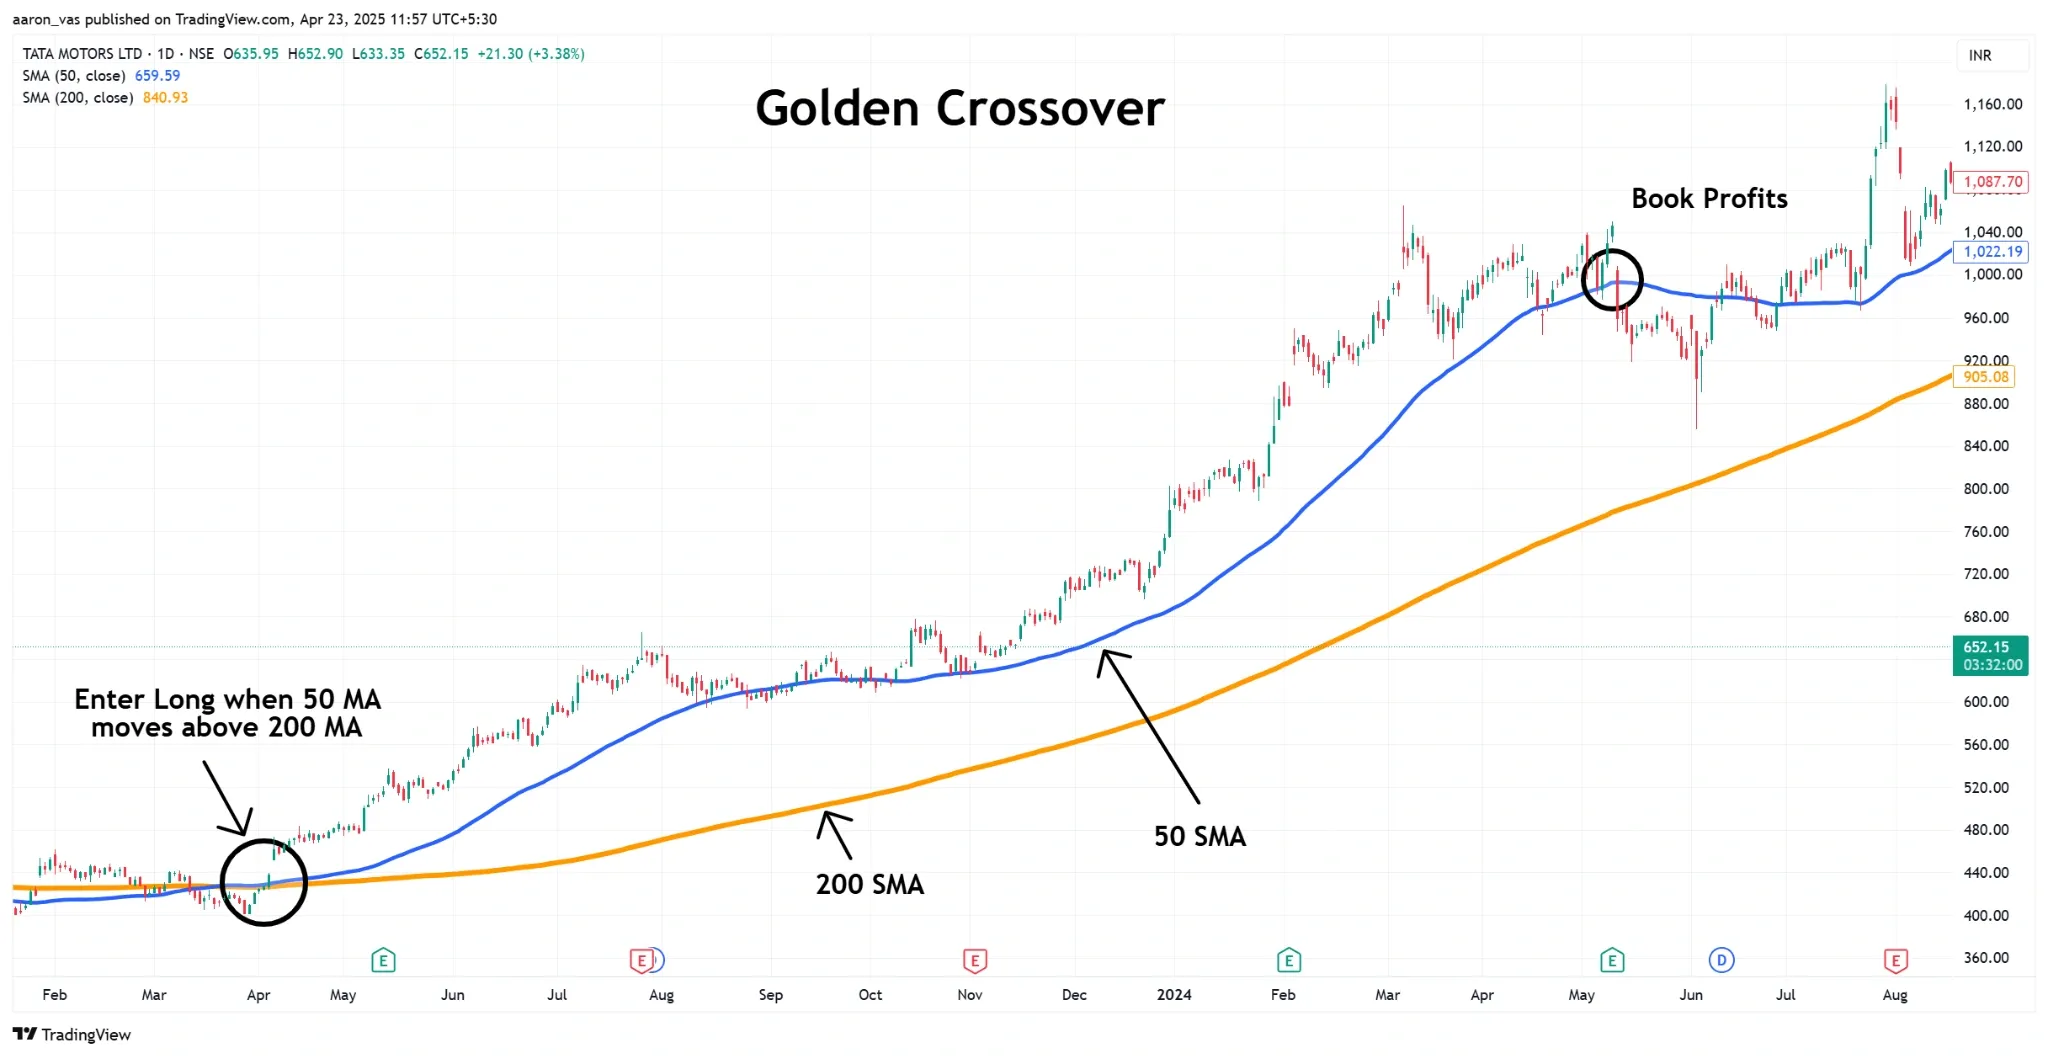
Moving average is a trend following indicator that shows the average price of the security over a specific over the selected time period, such as 9, 20, 50, or 200 days. This indicator is widely used among traders to identify the direction of the trend in a security. On the basis of its calculations, moving averages can be categorised into three, namely, Simple (SMA), Exponential (EMA), and Weighted Moving Average (WMA).
Among the above-mentioned, the Simple Moving Average is the best indicator for swing trading as it assigns equal weights to all price points within the selected time period, providing a balanced view of the market’s recent behavior without overreacting to short-term price spikes.
Furthermore, the Moving Average can of different time periods can used in conjunction with each other which allows traders to gauge both short-term momentum and long-term trend direction more effectively.
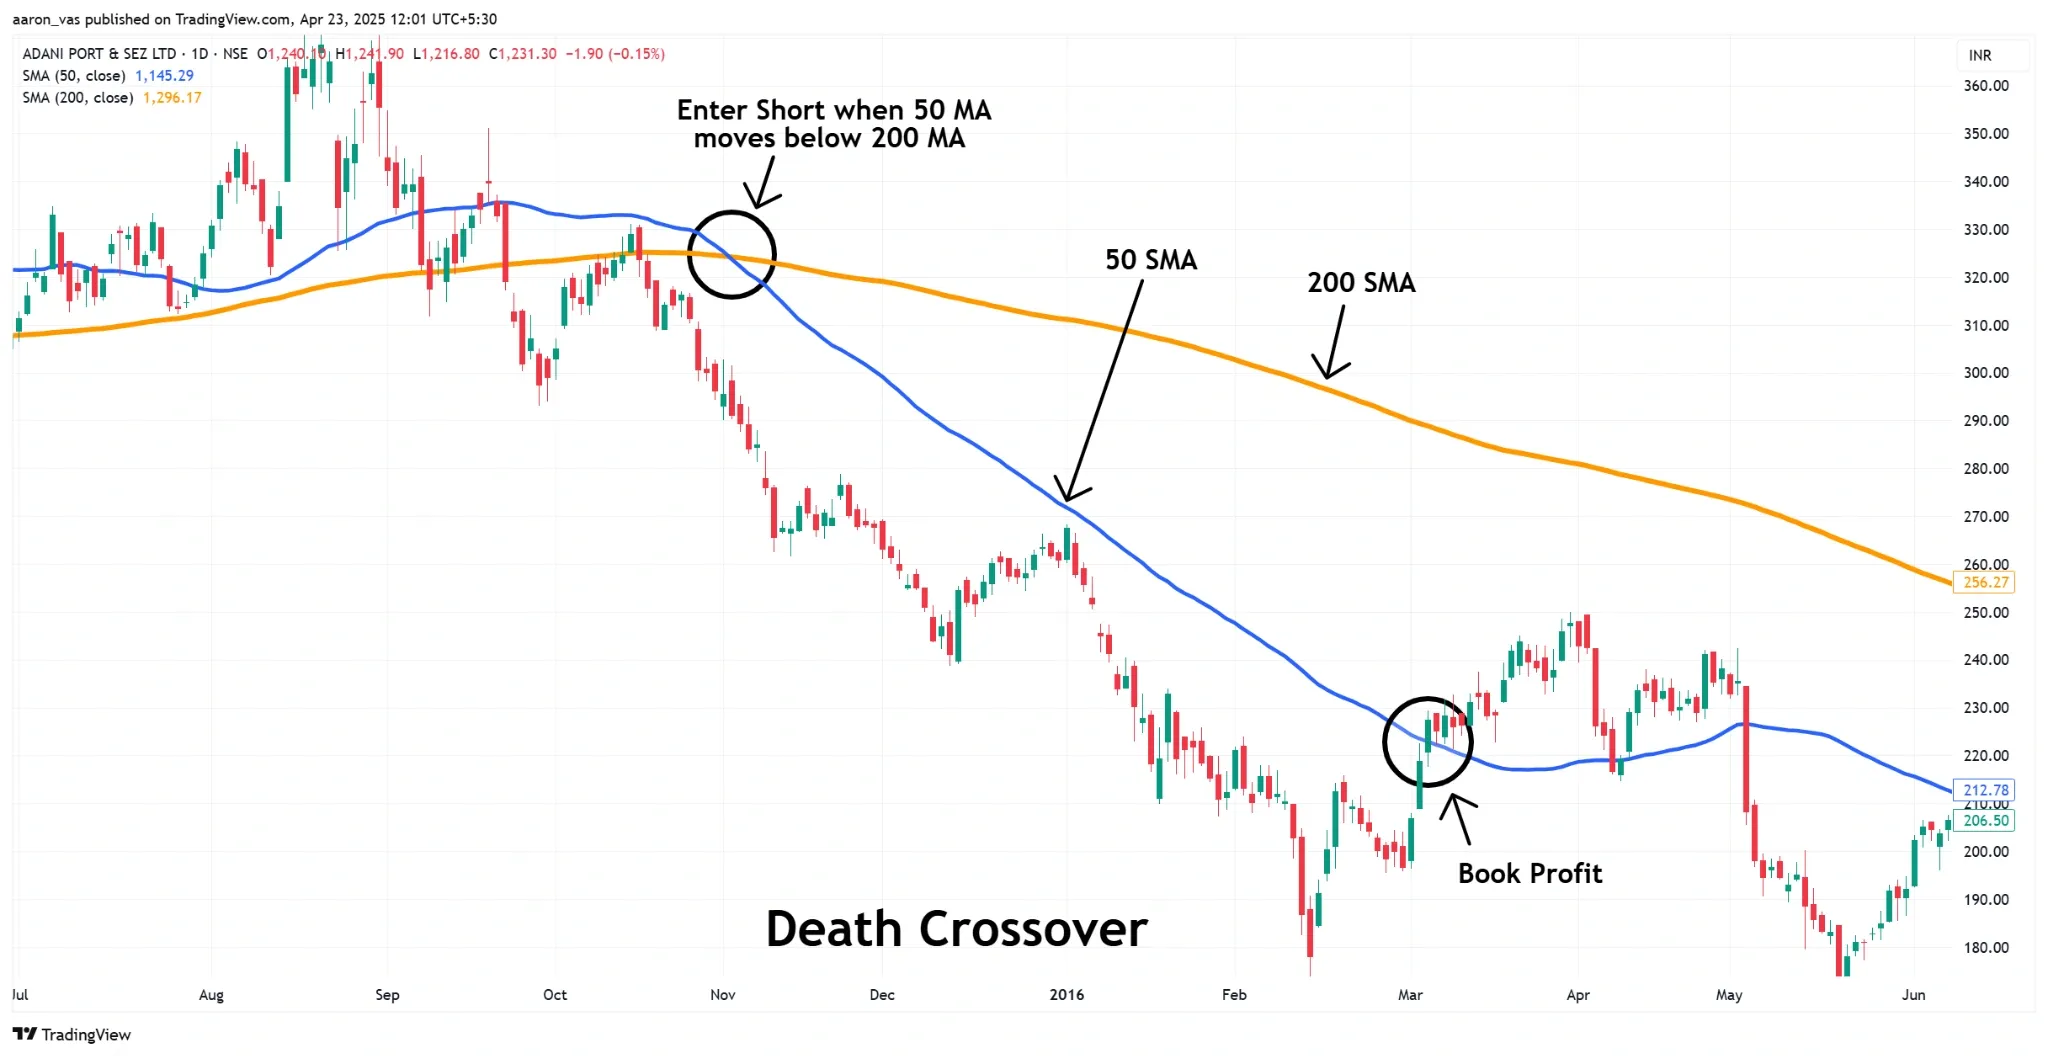
The combination of the 50-day SMA and 200-day SMA is one of the most effective setups for swing trading, as it helps identify long-term trend direction and potential momentum shifts with clarity. In this setup, when the 50-day SMA crosses above the 200-day SMA, also referred to as the Golden-Cross, it signals a potential transition to a bullish trend.
How to use it:
Here, traders can enter a long position when a green candle closes above the crossover signal. One can place a stoploss a few points below the entry and book profits in the trade when the price closes below the 50-day SMA or near the immediate resistance level.
Similarly, when the 50-day SMA crosses below the 200-day SMA, also referred to as the Death-Cross, it signals a potential transition to a bearish trend. Here, traders can enter a short position when a red candle closes below the crossover signal. One can place a stoploss a few points above the entry and book profits in the trade when the price closes above the 50-day SMA or near the immediate support level.
3) Relative Strength Index
RSI is a momentum indicator that helps traders measure the speed and magnitude at which the price of any security changes. This indicator oscillates within the range of 0 to 100 and helps the trader identify if the security is in an overbought zone or oversold zone.
While this indicator does not exactly pinpoint the levels of entry, it can act as a supportive tool for other indicators like the moving average or your price-action analysis.
How to use it:
The application of the RSI indicator is pretty simple. When the RSI is below the range of 30, it is considered that the security is in the oversold zone, and there might be a potential reversal towards the uptrend. Here, the traders can consider entering a long position in the security.
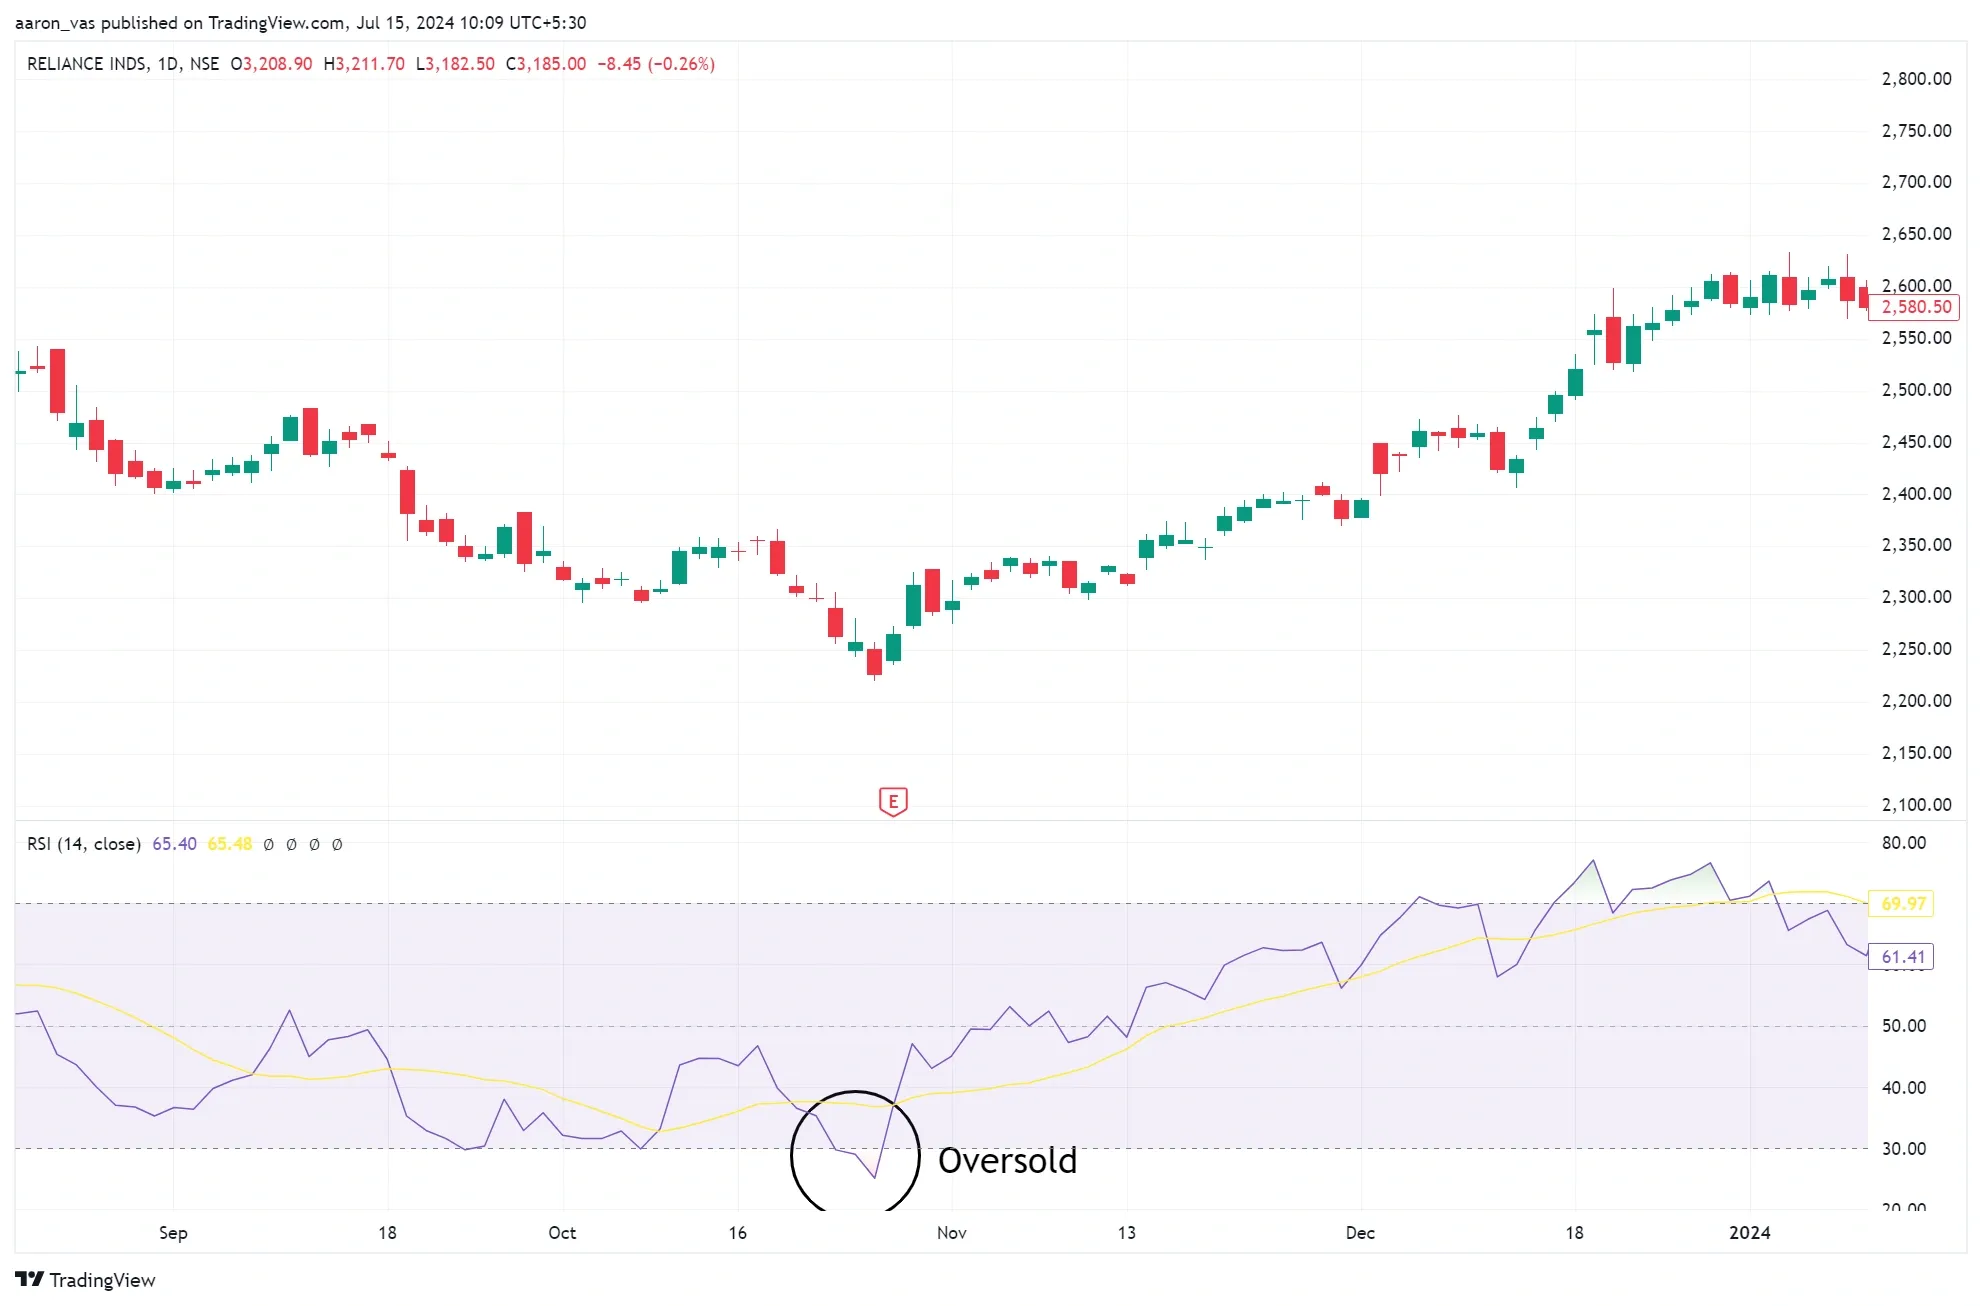
Conversely, if the RSI is above the range of 70, it is considered that the security is in the overbought zone and there might be a potential reversal towards the downtrend. Here, the traders can consider entering a short position in the security.
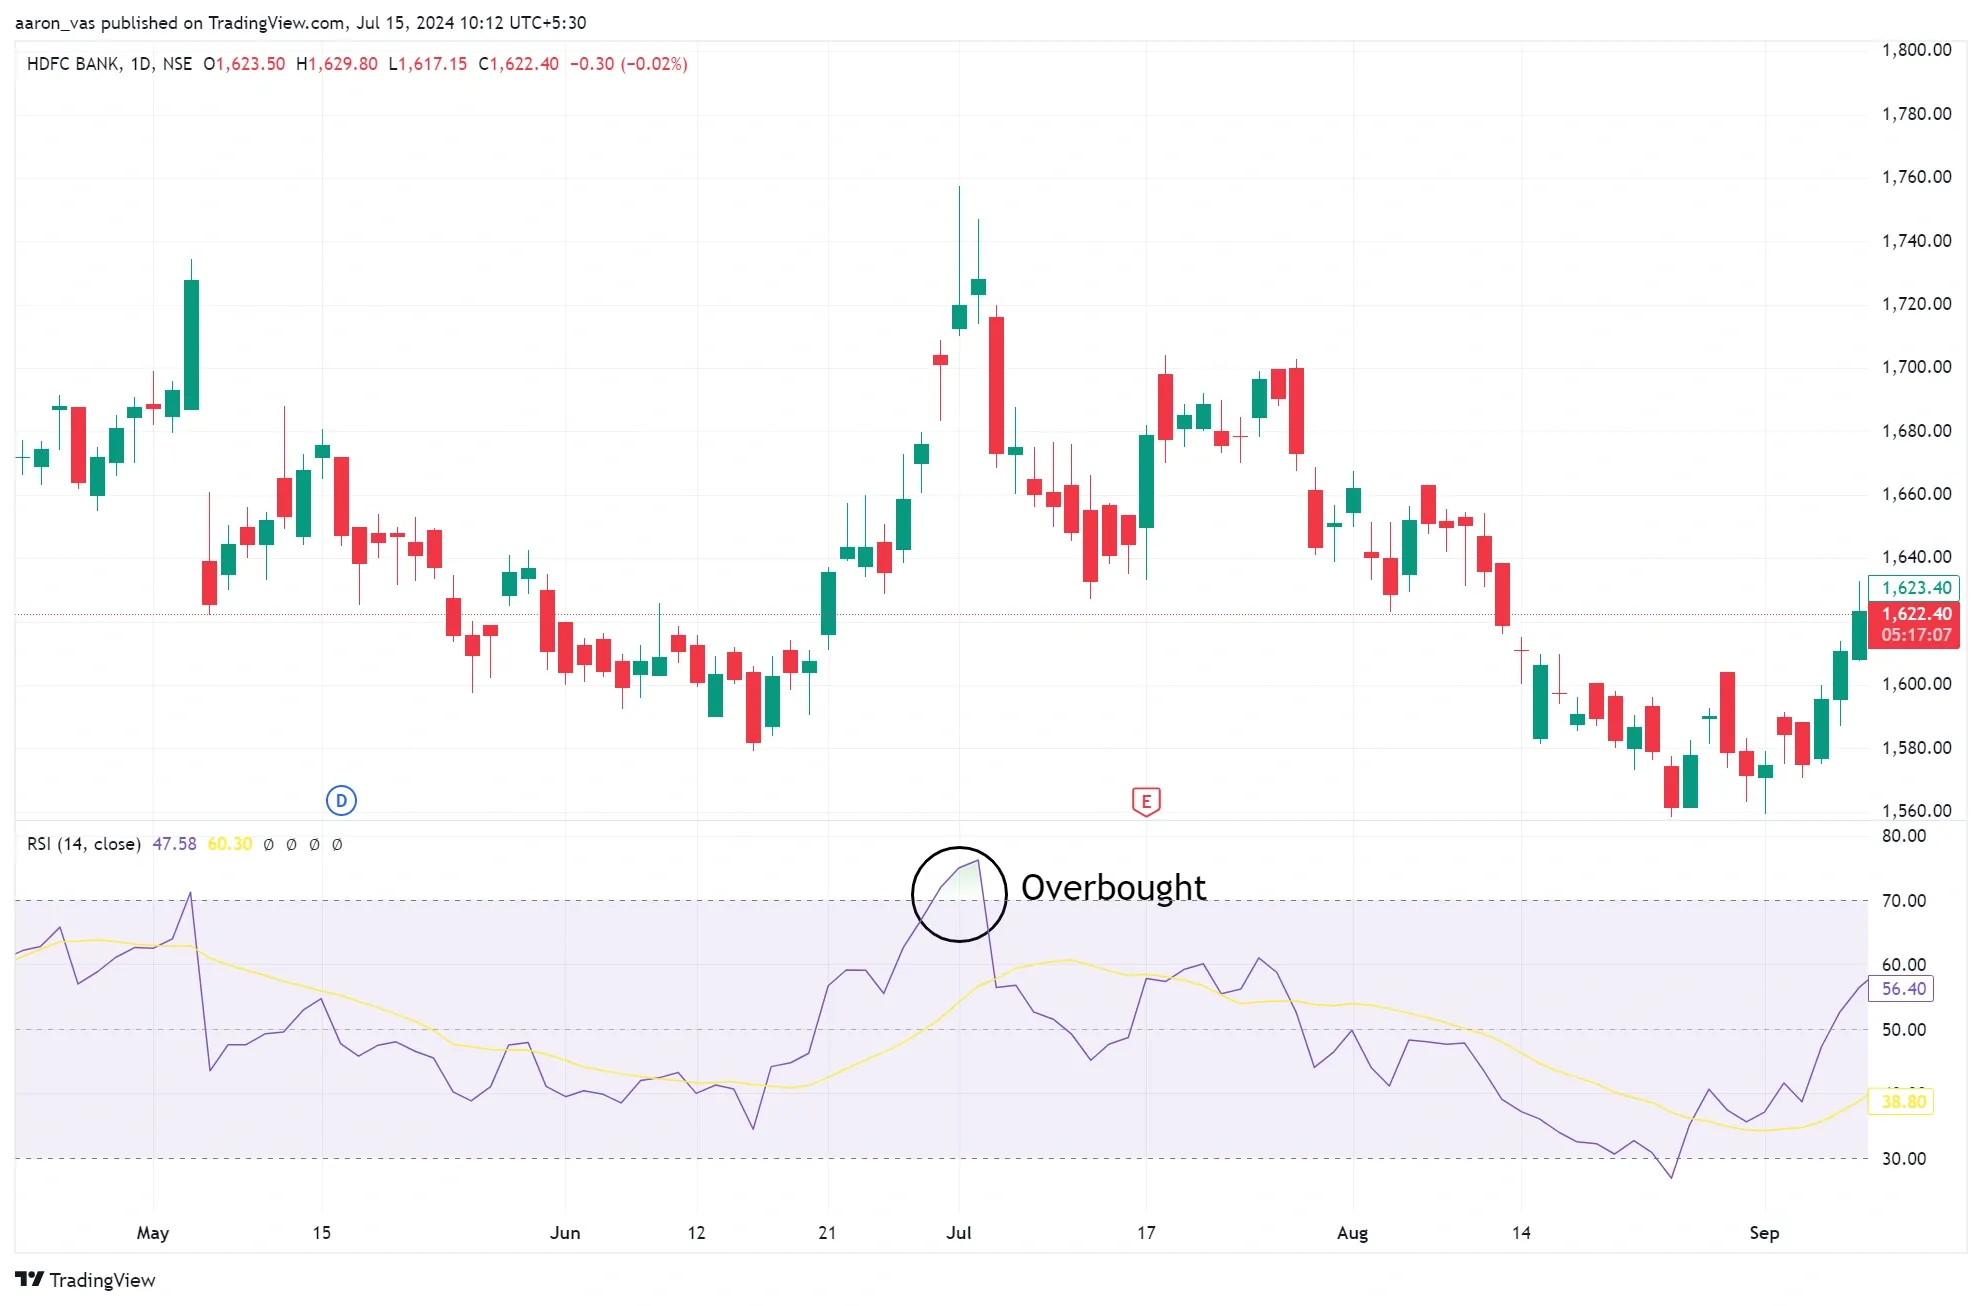
However, it is always better to have a prior interpretation based on other indicators or your price action analysis. Apart from the basic use, RSI also consists of other strategies, which you can read in our article ‘Best RSI Strategy’.
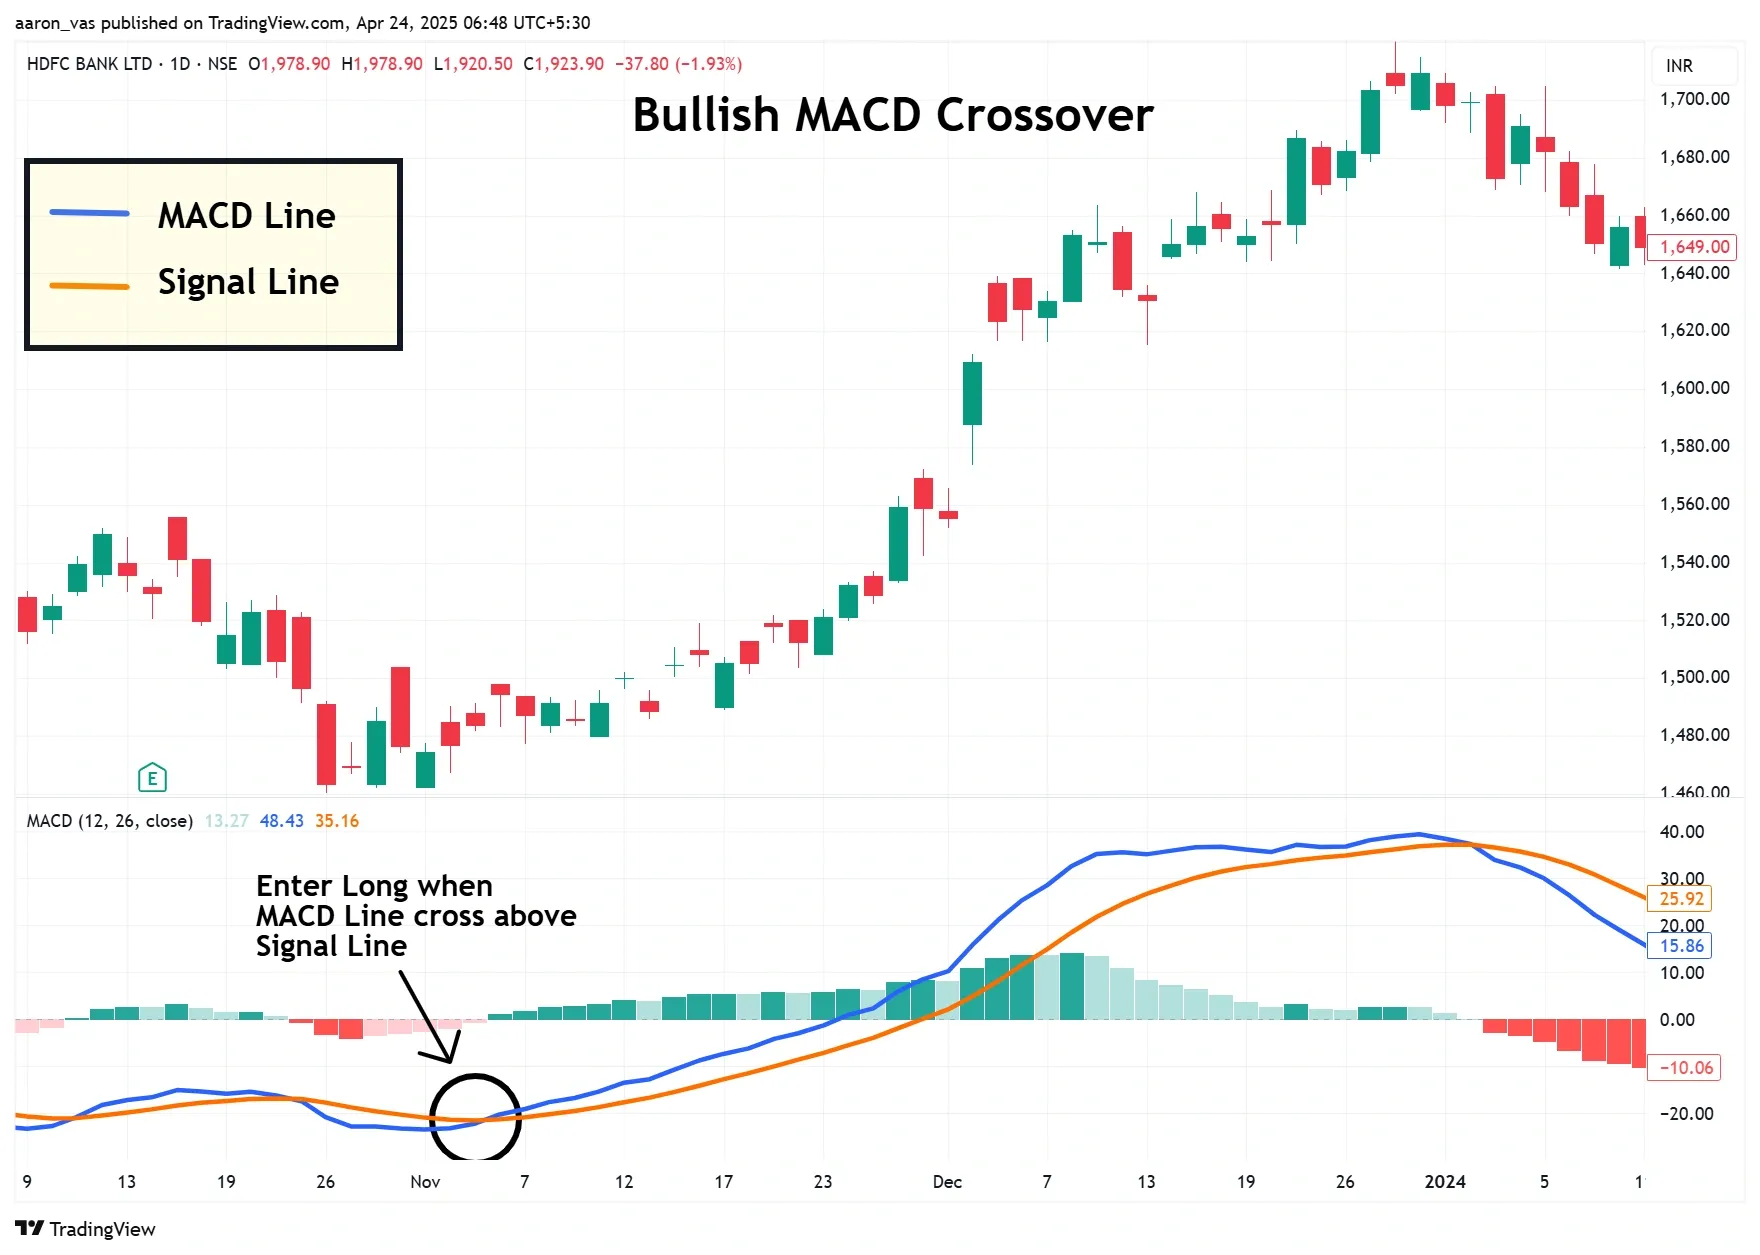
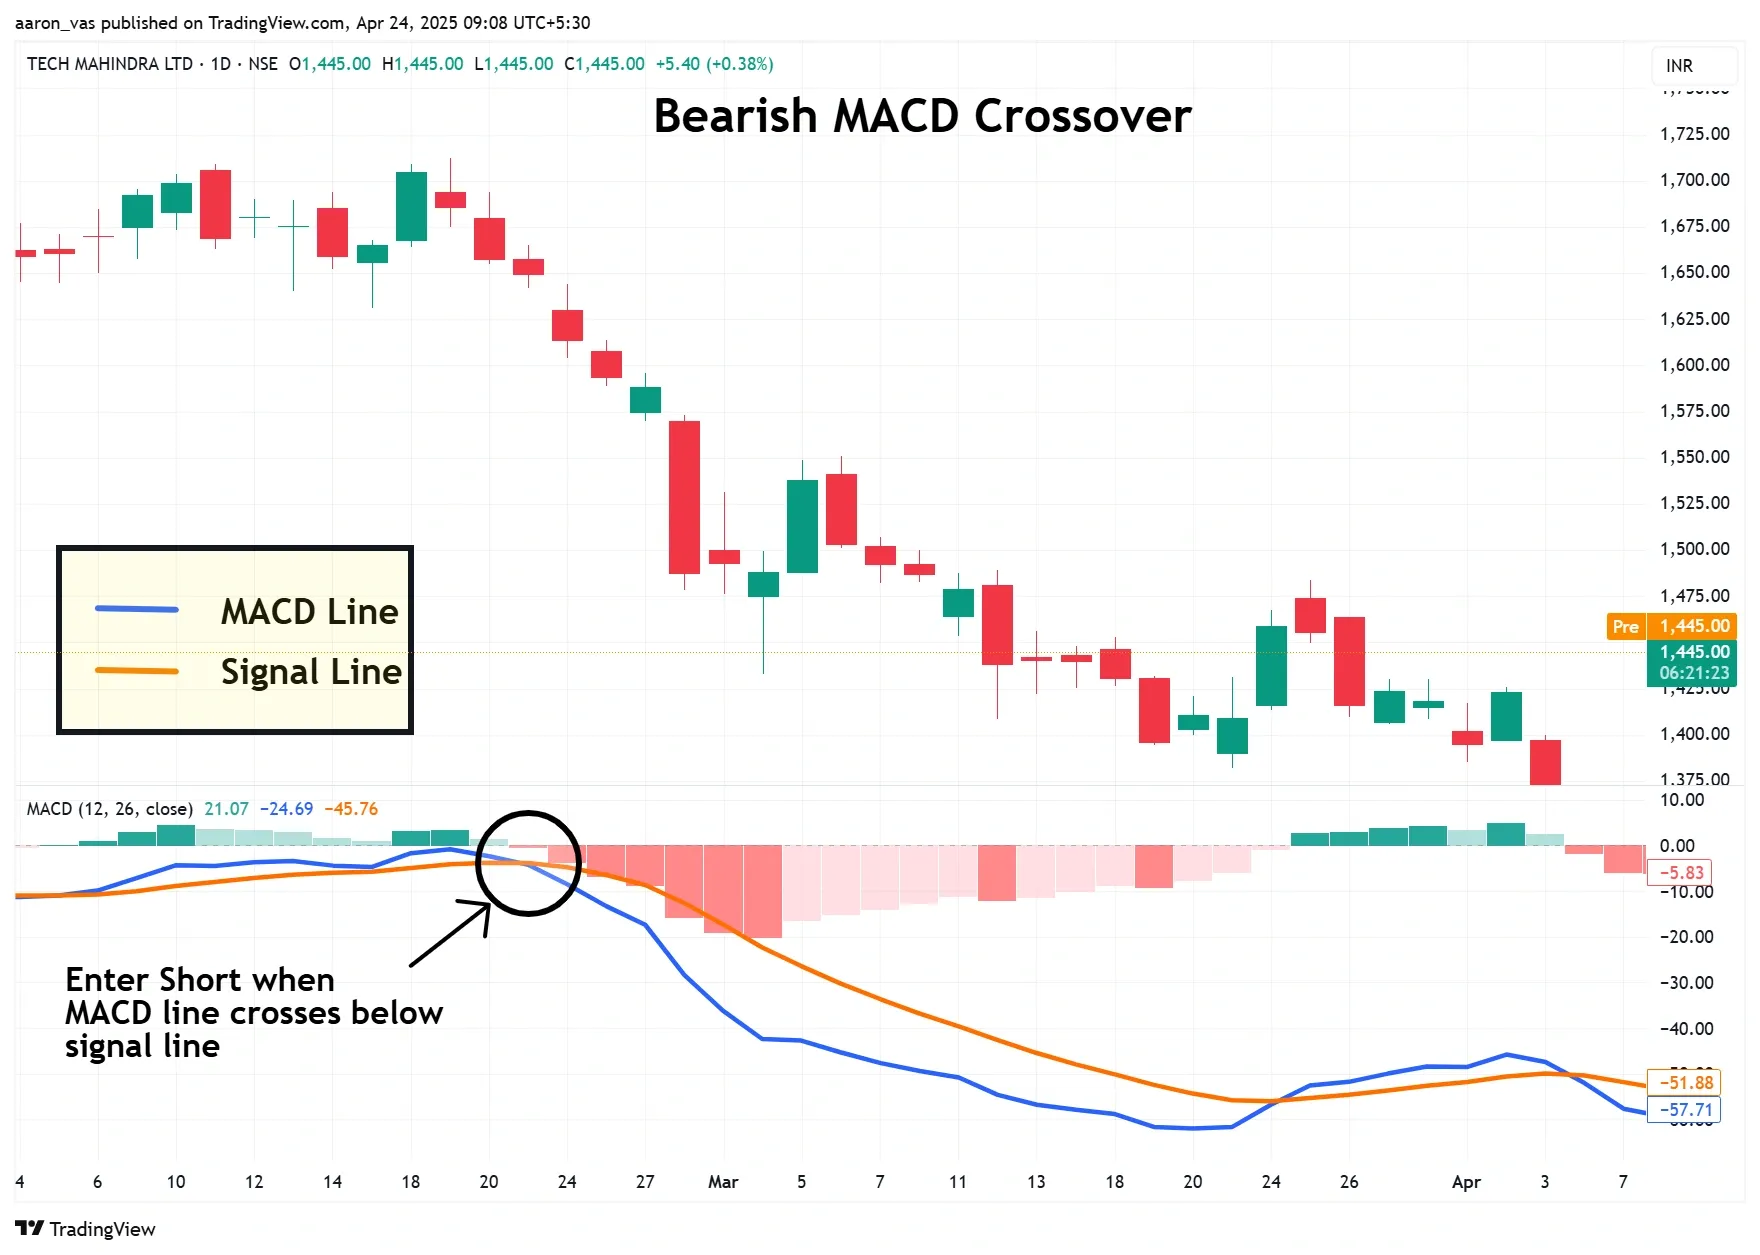
4) MACD Indicator
The MACD (Moving Average Convergence Divergence) is a trend following momentum indicator used to understand the direction of the trend in a particular security.
The MACD indicator is made up of three components: the MACD Line, which is the difference between the 12-day and 26-day Exponential Moving Averages (EMAs) and reflects momentum; the Signal Line, a 9-day EMA of the MACD Line that acts as a trigger for potential buy or sell signals; and the Histogram, which shows the gap between the MACD Line and the Signal Line.
Together, these elements make MACD a powerful tool for identifying trend changes and entry or exit points in trading.
How to use it:
When the MACD line crosses above the signal line, one can look to enter a long position in the security. You can consider booking profits in the trade when the MACD Line starts to flatten or crosses below the Signal Line.
Similarly, if the MACD line crosses below the signal line, one can look to enter a short position in the security. You can consider booking profits in the trade when the MACD Line starts to flatten or crosses above the Signal Line.
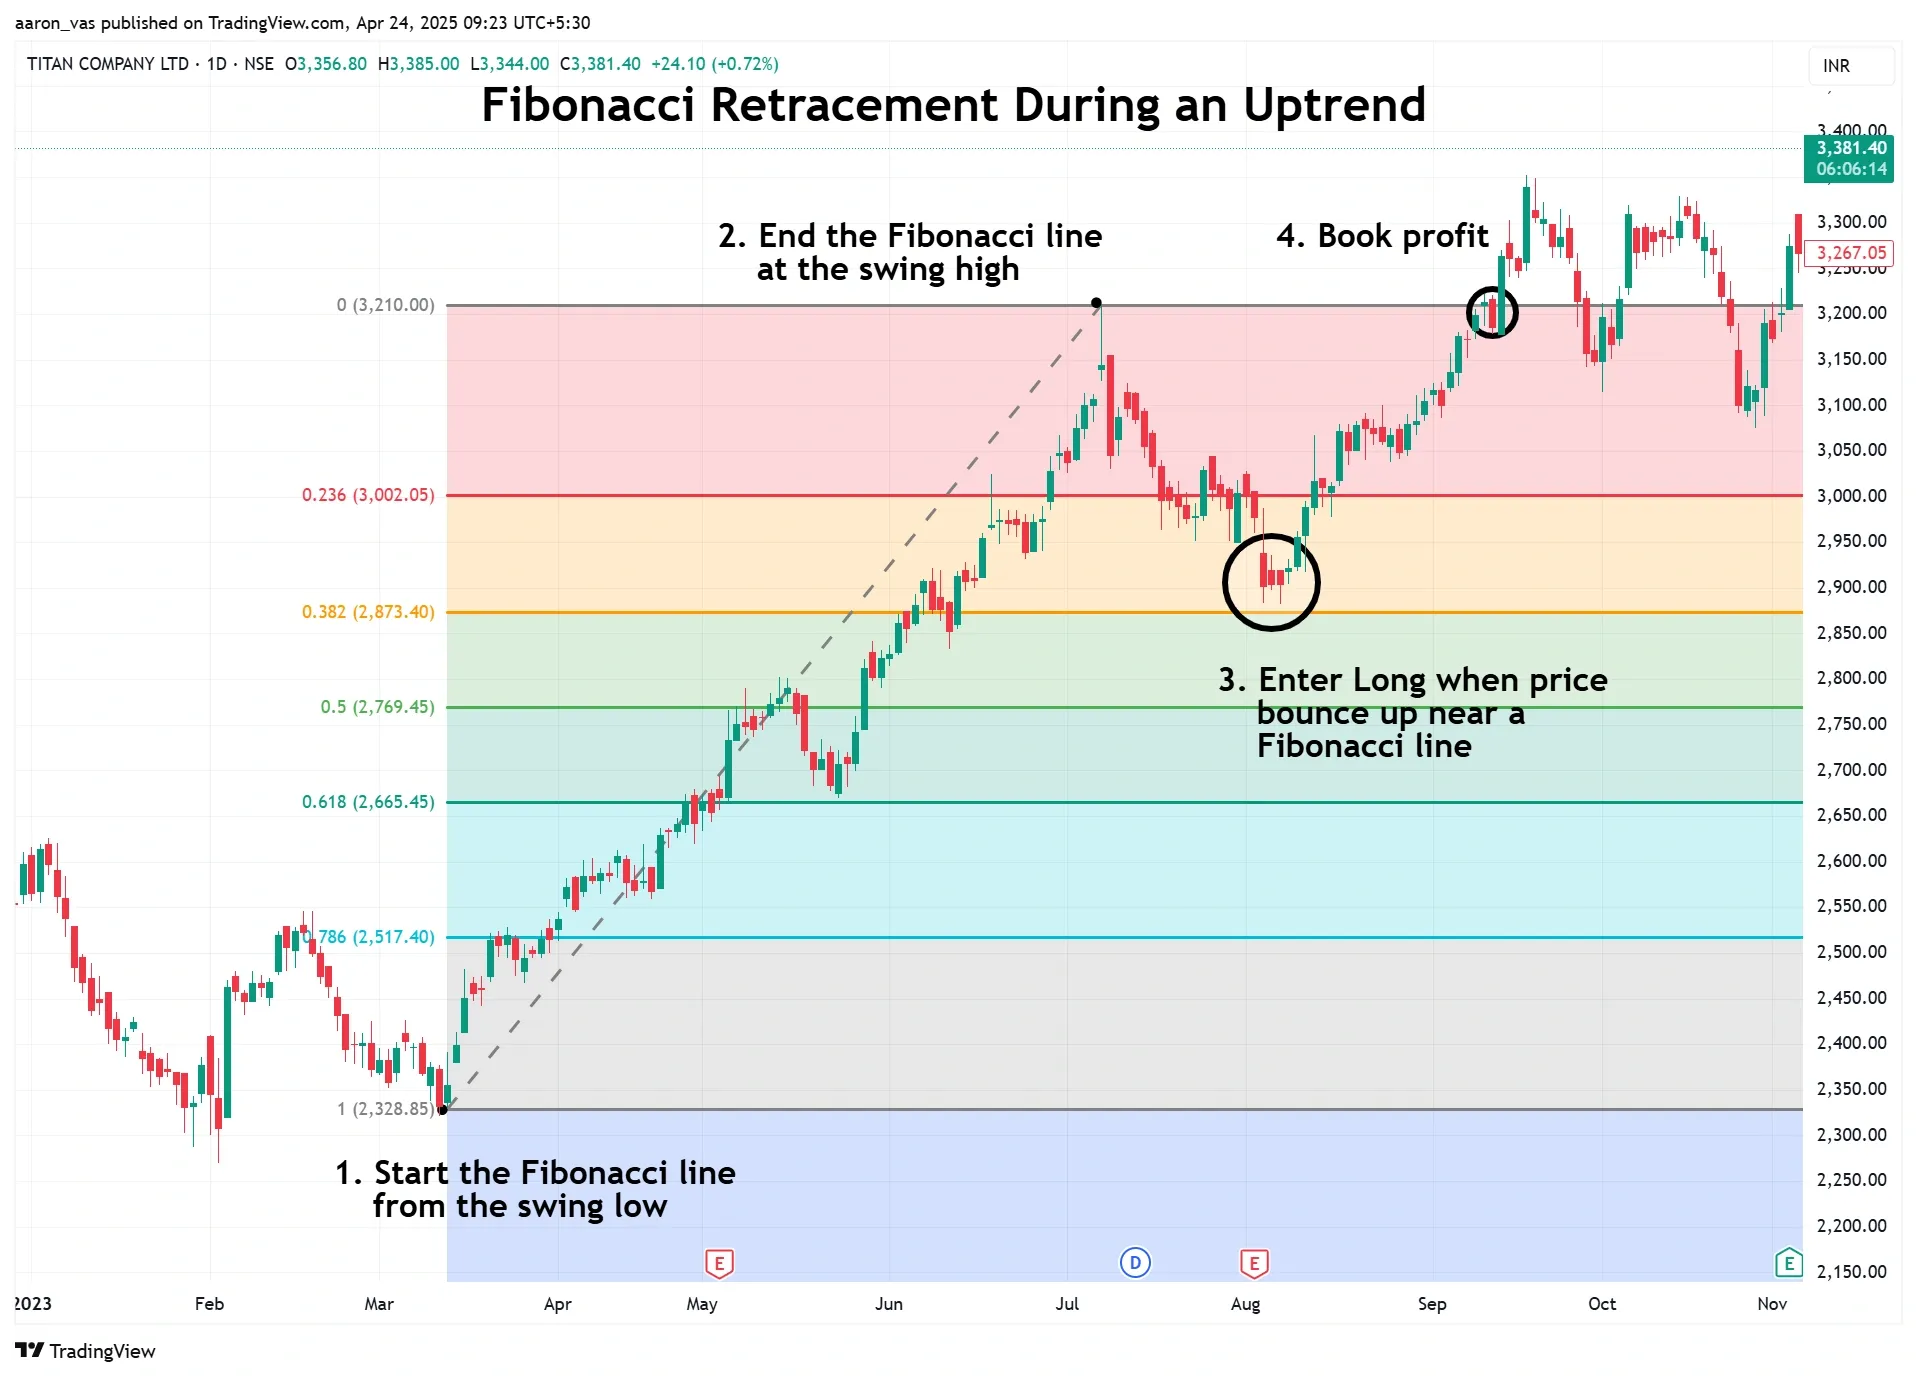
5) Fibonacci Retracement
Fibonacci Retracement is a technical analysis tool that is used by traders to identify potential support and resistance levels during a correction. This tool is based on the Fibonacci sequence, which can be observed in flowers, hurricanes, and even the huge spirals in the galaxies. Many believe this sequence is also reflected in the markets due to human psychology.
To use the Fibonacci retracement tool, traders have to plot the high and low on the price chart, which will automatically give them the horizontal lines at the key Fibonacci levels. These lines act as support and resistance zones where the price might temporarily halt, reverse, or consolidate before continuing in the direction of the overall trend. In simple words, these tools are useful for finding out the level at which the price may continue in the direction of the original trend after the temporary pullback.
How to use it:
When a security experiences a pullback during an uptrend, use the Fibonacci Retracement tool by plotting from the swing low (start of the uptrend) to the swing high (where the pullback begins) to identify potential support levels. If the price shows signs of resuming the uptrend near one of the key Fibonacci levels, you can consider entering a long position. You can book profits in the trade near the previous high, which can acts as a resistance level.
In the case of a downtrend, the tool is applied in reverse. Plot the Fibonacci Retracement from the swing high (where the trend began) to the swing low (where the pullback starts). The retracement levels now act as potential resistance zones. If the price begins to turn back down from any of these levels, it may indicate a continuation of the downtrend, offering an opportunity to enter a short position in the security. You can book profits in the trade near the previous low, which can act as a support level.
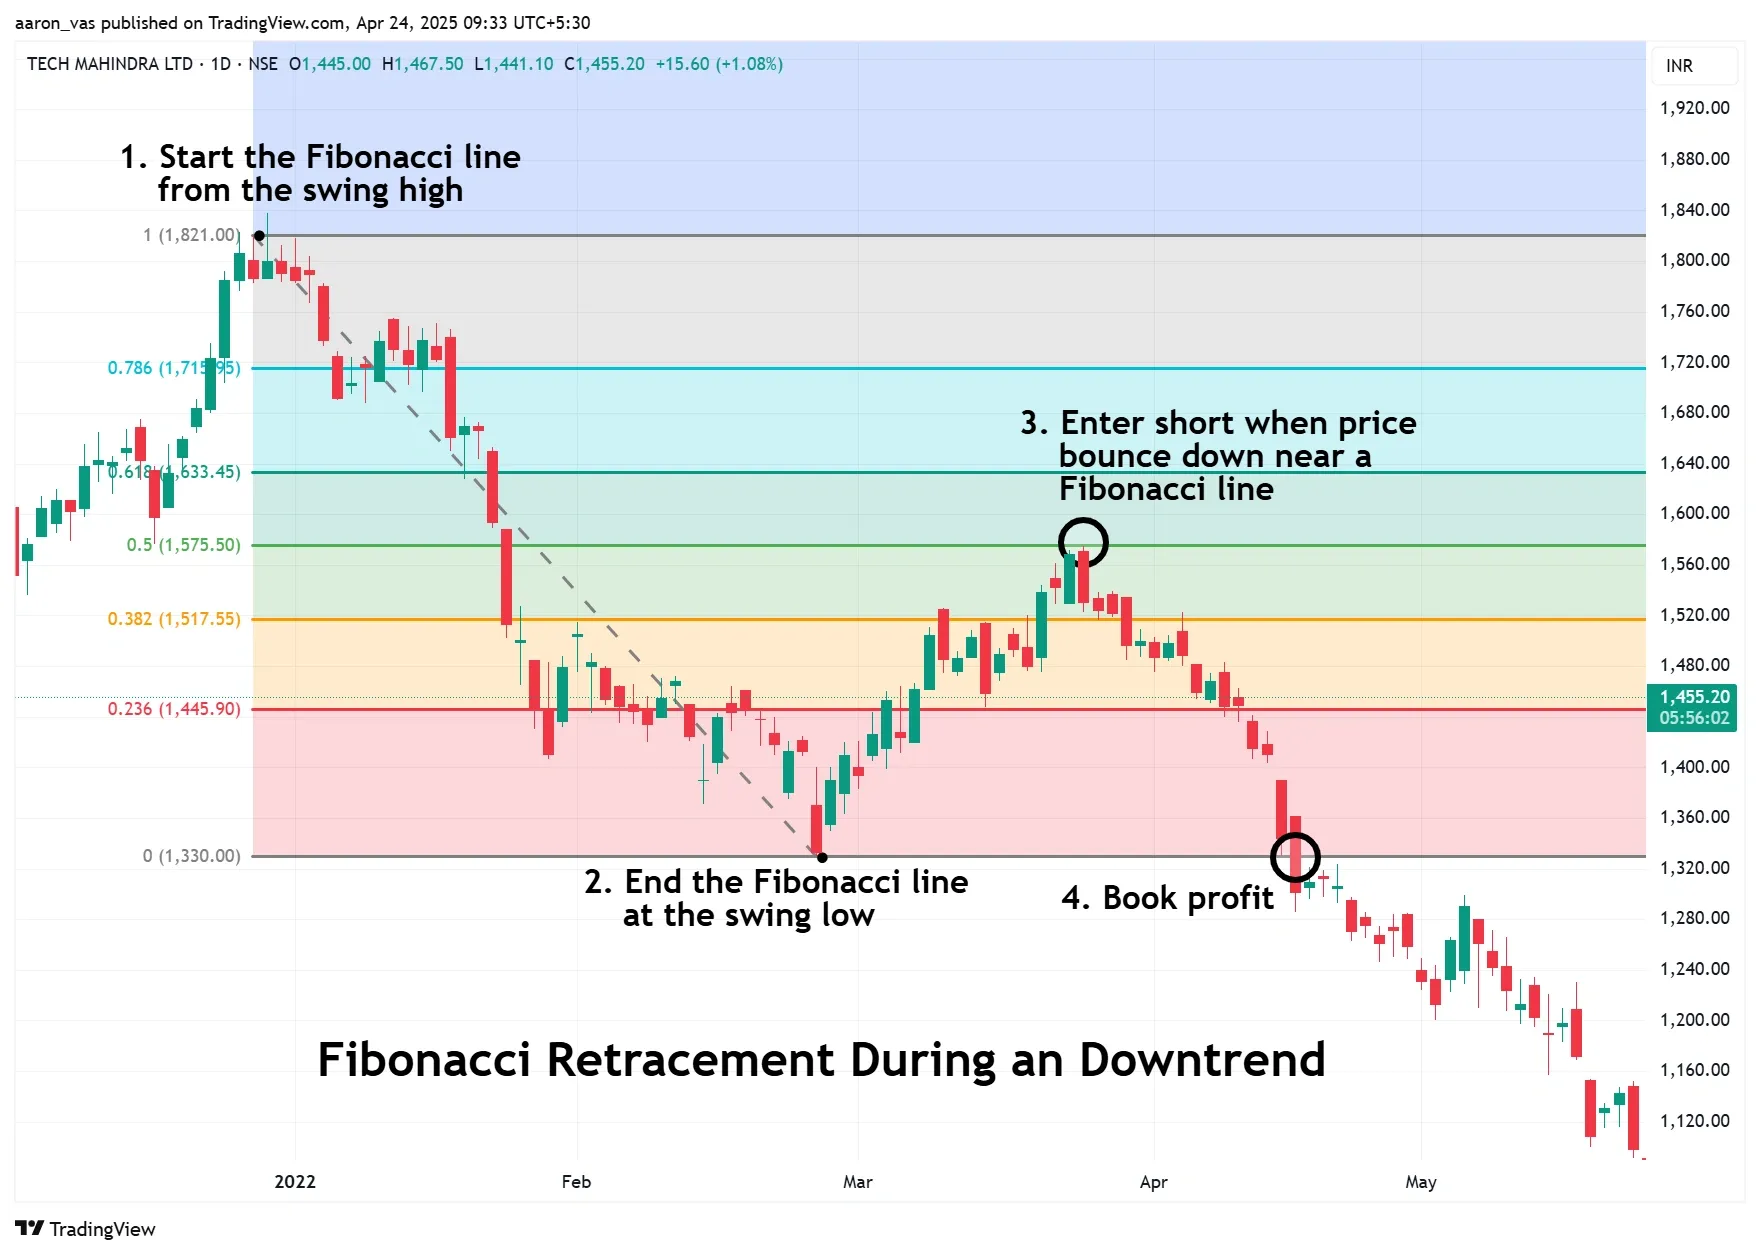
However, it’s important to note that if the price retraces beyond the 50% level on the Fibonacci scale, it may signal that the primary trend is weakening. A deeper retracement, especially beyond the 61.8% level, increases the likelihood that the trend may reverse, rather than resume in its original direction.
Limitations of Swing Trading Indicators
Even the best indicators for swing trading have their limitations. Below are a few important ones to keep in mind:
Dependence on Timeframes: Indicators can give different signals across different timeframes. For instance, a buy signal on a daily timeframe may look completely irrelevant across the weekly timeframes. Thus, one should always analyse the broader context of the market before making any decisions.
Can Encourage Overtrading: Indicators can give frequent signals, which may tempt traders to enter too many trades. However, entering too many trades without getting the desired results will only increase your transaction costs and risk exposure.
Conflicting Signals: Every indicator has its own premise for what it presents on the chart. This leads to the possibility of two different indicators giving you opposing signals. Therefore, the use of too many tools can clutter your judgment and leave you second-guessing your every move.
No Consideration of News or Events: Indicators ignore fundamental factors like earnings, macro news, or geopolitical events that can heavily impact price. This can lead to the market moving in the opposite direction than what the indicators suggest.
Common Myths Around Swing Trading Indicators
Indicators can predict the market: Many new traders believe that indicators can accurately predict future price movements. However, in reality, indicators only react to current prices rather than fully predict the future.
Indicators Replace Price Action: Indicators are great tools to confirm your analysis of the market. However, they should be used completely as a replacement for price action, as they show delayed signals and can miss important details that the actual price movement clearly shows.
Every Signal Guarantees Profits: While it is common for many to rely on indicators for their trading decisions, it should be noted that the indicators have the probability of giving false signals, especially in a volatile market. Therefore, confirming these signals with price action analysis and having proper risk management is important.
Key pointers for Swing Trading
While swing trading indicators can guide your trades, a few additional factors can significantly boost your chances of success. Let’s take a closer look at some of these key pointers.
1) Adequate Capital Requirement:
Since the duration of swing trades ranges from a few days to weeks, one needs to have a sizeable capital to capture good gains and diversify their investments. If you need additional capital beyond what you currently hold,
If you need additional capital beyond what you currently hold, Rupeezy offers a margin trading facility that allows you to trade with up to 5 times your available funds, helping you amplify your position size and seize more trading opportunities.
2) Stick to a Trading Plan
Before entering any trade, have a clear plan: define your entry point, target price, and stop-loss. Avoid making changes to your plan based on emotions. Following a consistent approach improves your discipline and long-term success rate.
3) Be Aware of Gap-Ups and Gap-Downs
Swing traders often hold positions overnight, which comes with the risk of price gaps due to earnings announcements, global events, or macroeconomic news. These gaps can result in significant losses if they go against your position. It’s wise to avoid holding trades ahead of high-impact news or have protection strategies in place.
Conclusion
While there are a large number of indicators available to choose from, the best indicator for swing trading will vary for different traders based on their trading style. However, it is important to note that, after selecting an indicator, one should always backtest the strategies that come with the indicator and implement proper trading rules so that it increases your probability of success.
Frequently Asked Questions (FAQs)
Q1. Can beginners rely on indicators for swing trading?
Yes, beginners can use indicators, but they should treat them as supporting tools, not decision-makers. It's important to combine indicators with price action and proper risk management for better results.
Q2. What is the most accurate swing trading indicator?
There’s no “most accurate” indicator for swing trading, but Volume, Moving Averages, and Fibonacci Retracement are considered highly reliable.
Q3. Which indicator is best for swing trading?
Volume indicator is one of the most effective tools for swing trading, especially when used alongside price action. It helps confirm the strength behind a move, rising volume with a breakout or pullback.
Q4. What's easier, day trading or swing trading?
Swing trading is generally considered easier for beginners since it requires less time monitoring the market compared to day trading. Day trading demands quick decisions, constant attention, and higher risk due to intraday volatility.
Q5. Which timeframes should I use for swing trading?
For swing trading, use the daily chart to spot trends and the 4-hour or hourly chart to time entries. These timeframes balance trend clarity with timely execution.
Check Out These Related Articles |
The content on this blog is for educational purposes only and should not be considered investment advice. While we strive for accuracy, some information may contain errors or delays in updates.
Mentions of stocks or investment products are solely for informational purposes and do not constitute recommendations. Investors should conduct their own research before making any decisions.
Investing in financial markets are subject to market risks, and past performance does not guarantee future results. It is advisable to consult a qualified financial professional, review official documents, and verify information independently before making investment decisions.

Open Rupeezy account now. It is free and 100% secure.
Start Stock Investment


All Category