RSI Divergence – Bullish and Bearish Strategy to Trade

00:00 / 00:00
Identifying potential trend reversals or continuations is crucial for making informed trading decisions. Traders use various tools for this purpose, and one of the most effective among them is RSI divergence. By comparing price movements with the Relative Strength Index (RSI), traders can detect early signs of reversals or trend continuations, giving them an edge in the market.
In this article, we’ll break down the concept of RSI divergence and guide you on how to trade effectively using this powerful tool.

What Is RSI (Relative Strength Index)?
Developed by J. Wells Wilder, the RSI is a momentum indicator that measures the speed and magnitude of the change in the price of stocks or any other security. This indicator oscillates between 0 and 100 and helps traders identify whether a security is overbought or oversold.
Traditionally, an RSI reading above 70 indicates that a security is overbought, suggesting that it may be overvalued and due for a price correction or pullback. Conversely, an RSI reading below 30 suggests that a security is oversold, indicating it may be undervalued and poised for a potential upward reversal.
Well, this was a brief overview of how RSI works. If you would like to know more about the RSI indicator, read our article on mastering the RSI indicator.
What Is RSI Divergence?
In the above section, we learnt that the RSI indicator typically moves in tandem with the price of the security. However, there are instances when the RSI indicator is moving in the opposite direction of the price of the security. These instances are referred to as RSI divergence.
Based on how the price and the RSI are moving, the RSI divergence can be categorised into 4 types:
1) Bullish RSI Divergence
2) Bearish RSI Divergence
3) Bullish Hidden RSI Divergence
4) Bearish Hidden RSI Divergence
How to Identify and Trade RSI Divergence Patterns?
RSI divergence patterns help traders spot potential trend reversals or continuations. Learn how to identify and trade bullish, bearish, and hidden RSI divergence effectively:
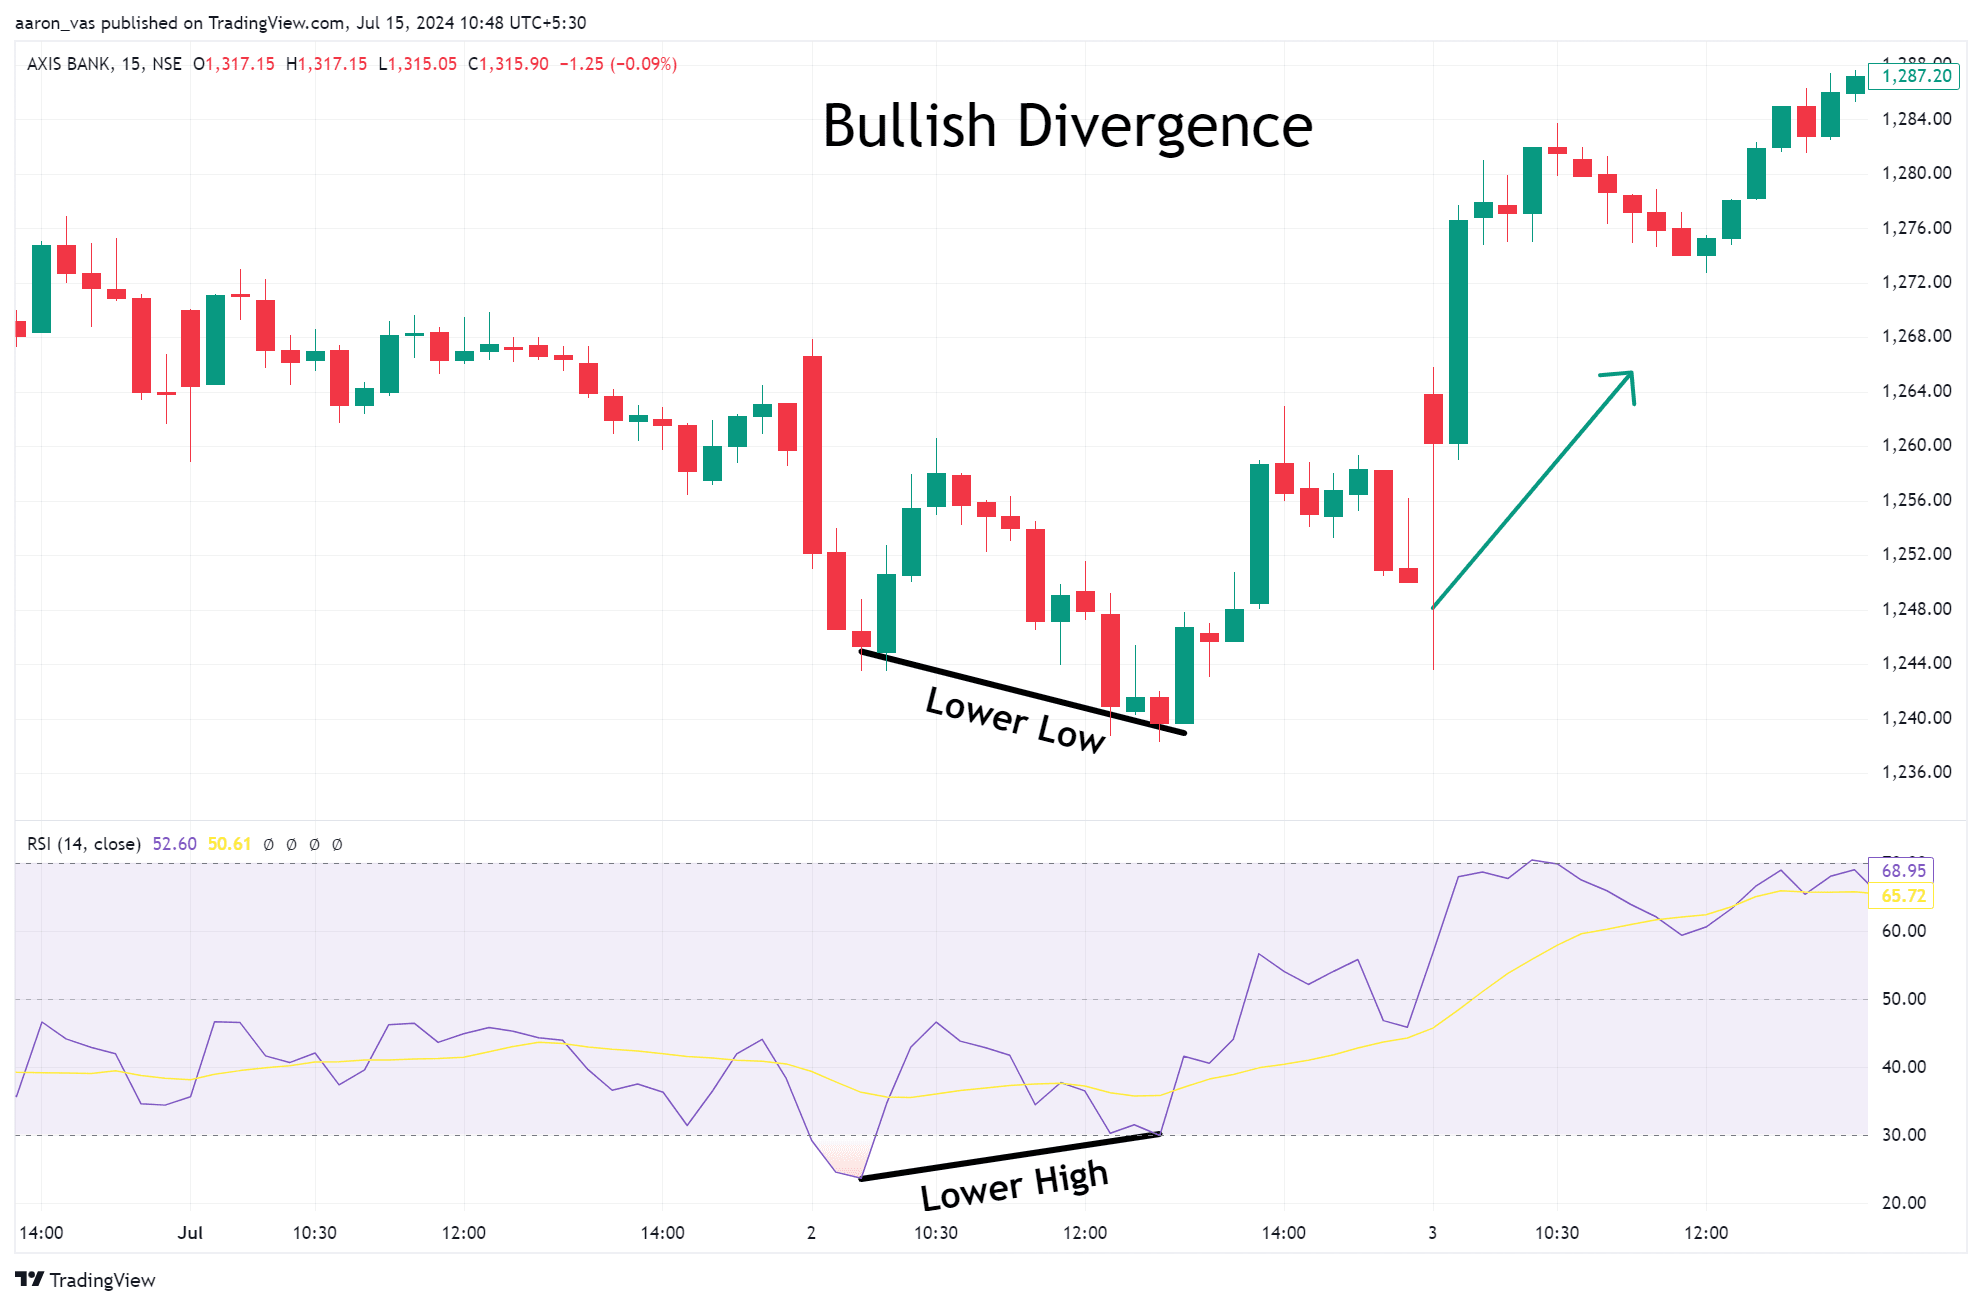
1) Bullish RSI Divergence
A bullish RSI divergence is an occurrence where the price of the security is forming lower lows while the RSI indicator is forming higher lows. This divergence indicates that while the prices are moving downward, the bearish momentum is weakening or temporarily pausing and suggests a potential bullish reversal.
How to trade:
Identification: The price of the security will form consecutive lower lows while the RSI will form higher lows during the same period.
Entry: Once the bullish divergence is identified, look for additional confirmations of the reversal (for example, using moving averages) and enter a buy/long position in the security.
Stop loss: Based on your risk appetite, place a stop-loss order a few points below the entry level.
Profit Target: The profit target for bullish RSI divergence can be set at the nearest resistance level or it can be based on the risk-to-reward ratio.
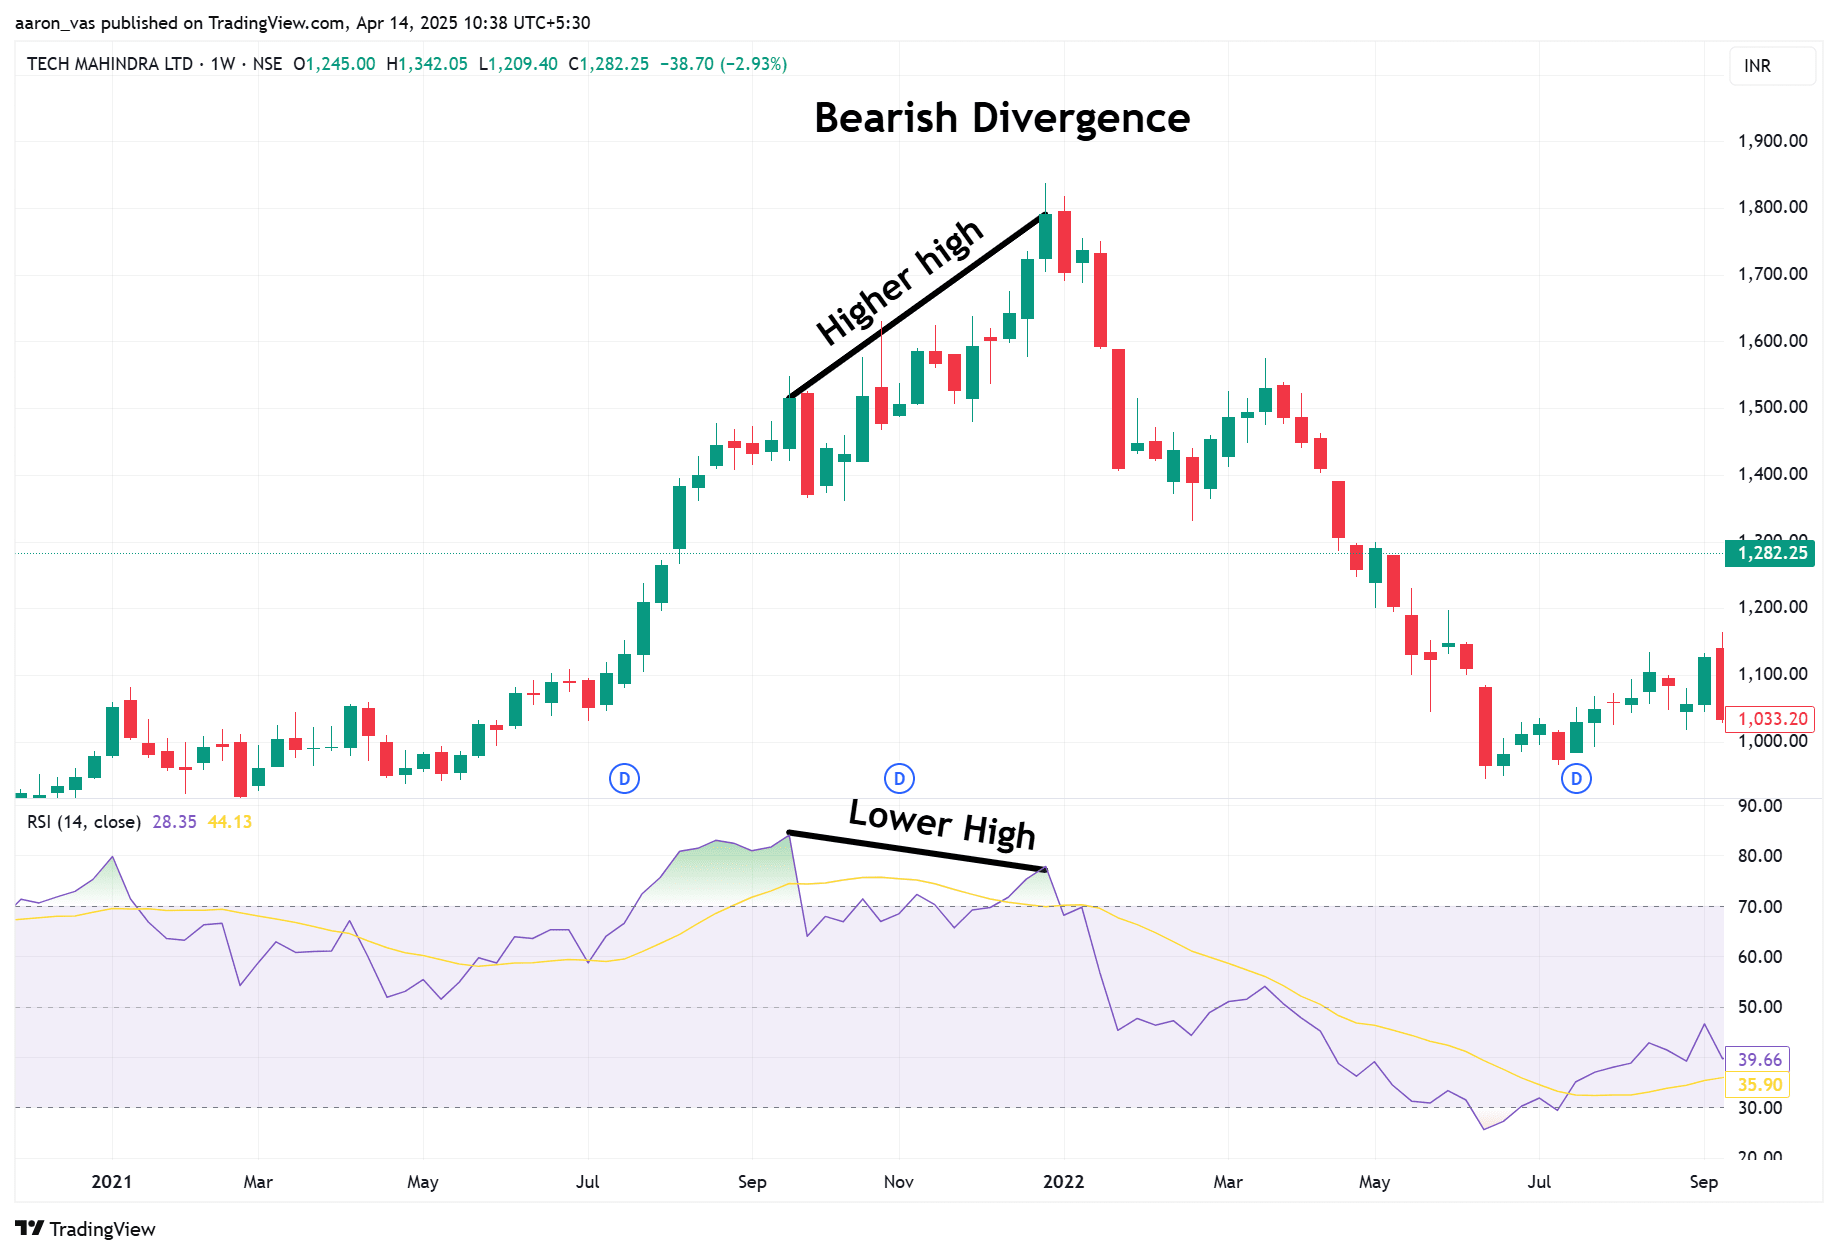
2) Bearish RSI Divergence
A bearish RSI divergence is an occurrence where the prices are forming higher highs while the RSI indicator is forming lower highs. This form of divergence indicates that while the prices are moving upward, the bullish momentum is weakening or temporarily pausing and suggests a potential bearish reversal.
How to trade:
Identification: The price of the security will form consecutive higher highs while the RSI will form lower highs during the same period.
Entry: Once the bearish divergence is identified, look for additional confirmations of the reversal and enter a sell/short position in the security.
Stop loss: Based on your risk appetite, place a stop-loss order a few points above the entry level.
Profit Target: The profit target for bearish RSI divergence can be set at the nearest support level, or it can be based on the risk-to-reward ratio.
3) Bullish Hidden RSI Divergence
Unlike regular divergence indicates a trend reversal, hidden divergences indicate that the existing trend will continue in the security.
A hidden bullish RSI divergence occurs when the price of the security is making higher lows while moving in the upward direction, and the RSI indicator is making lower lows. This suggests that, despite the temporary price pullback, the buyers are still in control and the security will likely continue to move in the upward direction.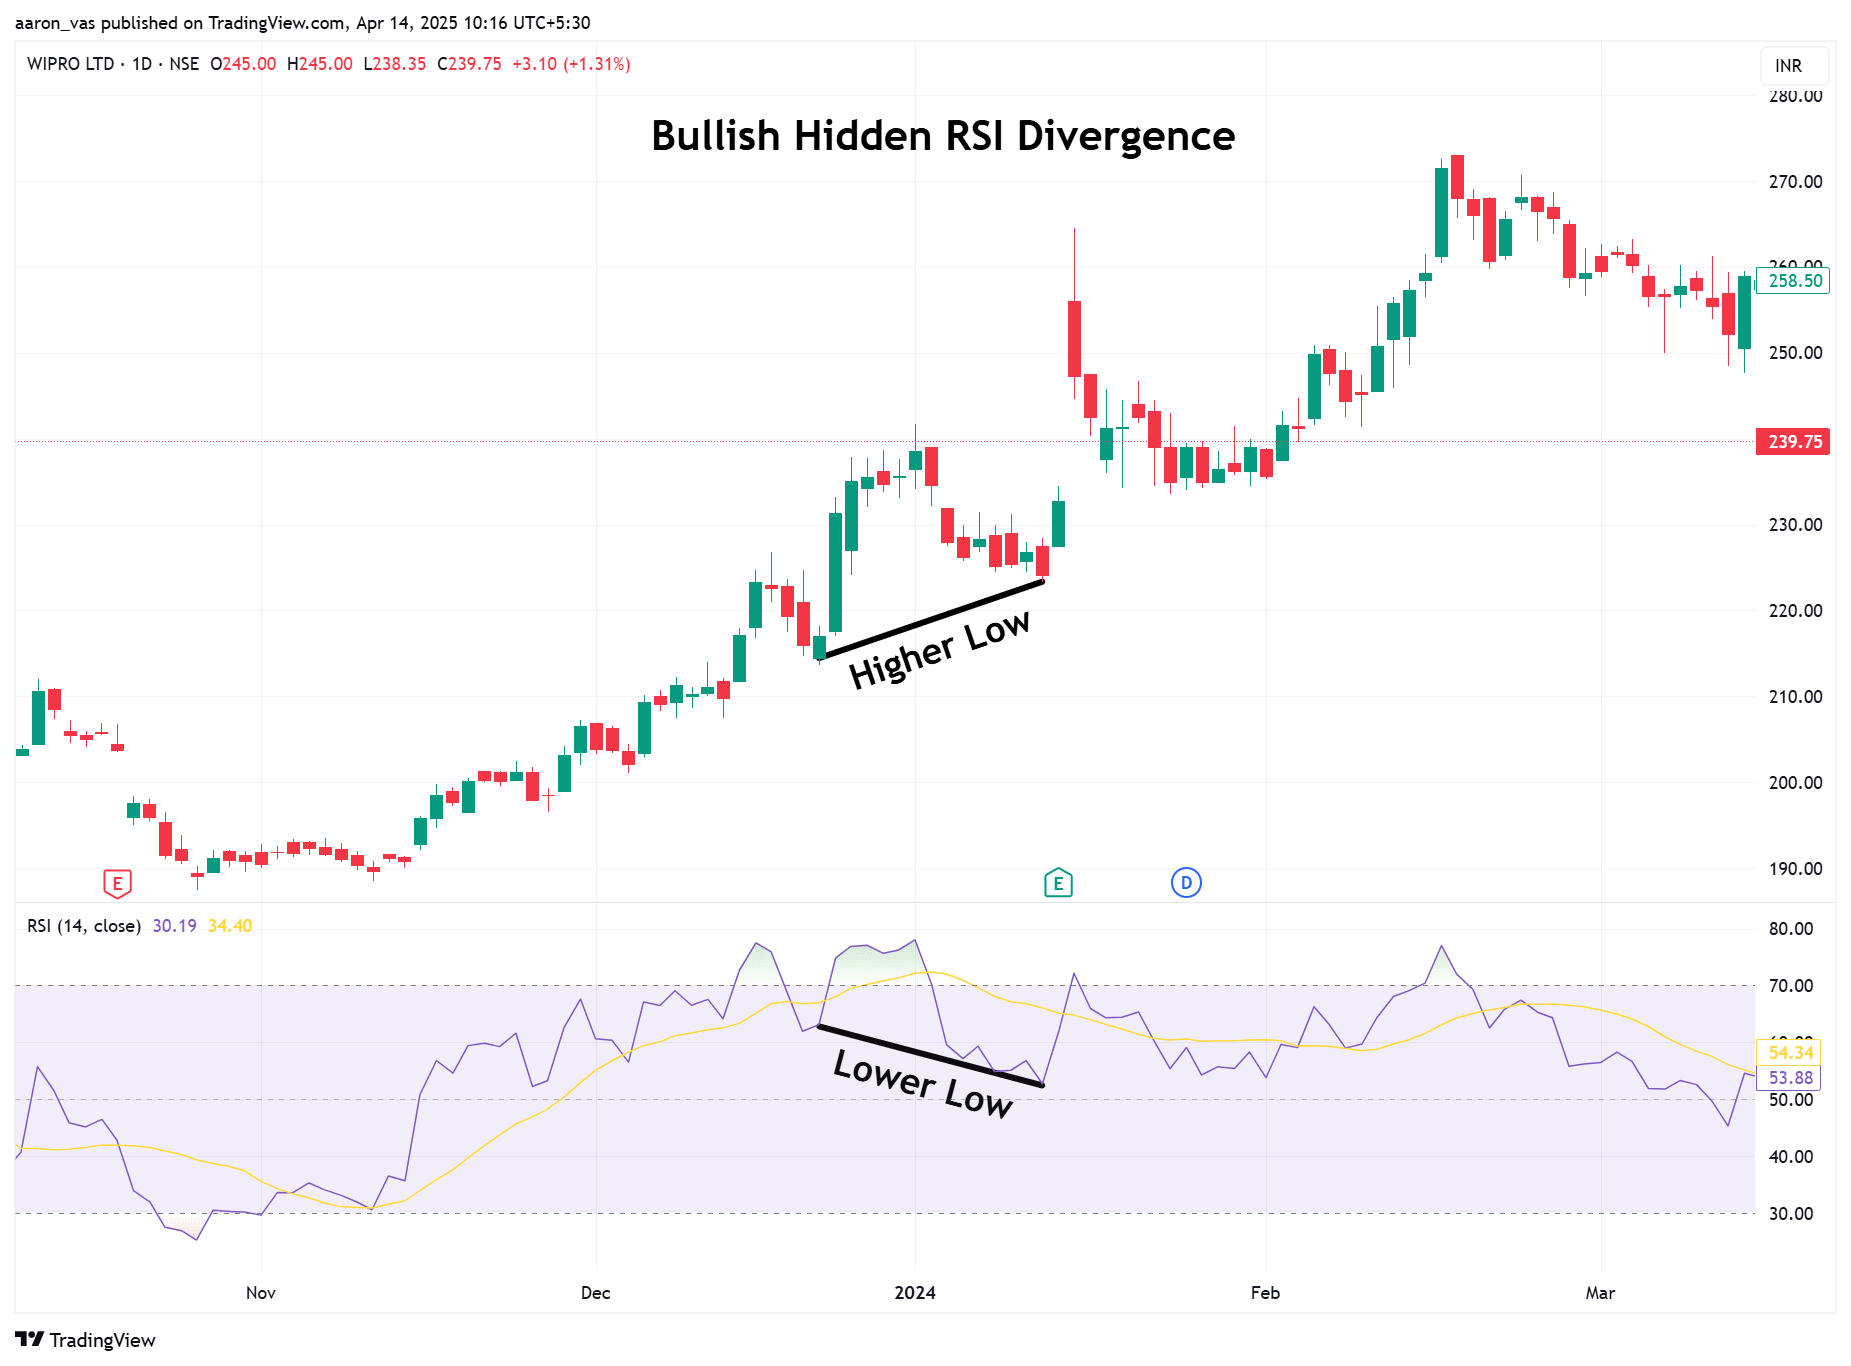
How to trade:
Identification: The price of the security will form consecutive higher lows while the RSI will form lower lows during the same period.
Entry: Once the hidden bullish divergence is identified, look for additional confirmations and enter a buy/long position in the security.
Stop loss: The Stop-loss for this trade should be placed near the recent higher low of the hidden divergence
Profit Target: One can use the risk-to-reward ratio or previous resistance levels to determine the profit for a bullish hidden divergence trade.
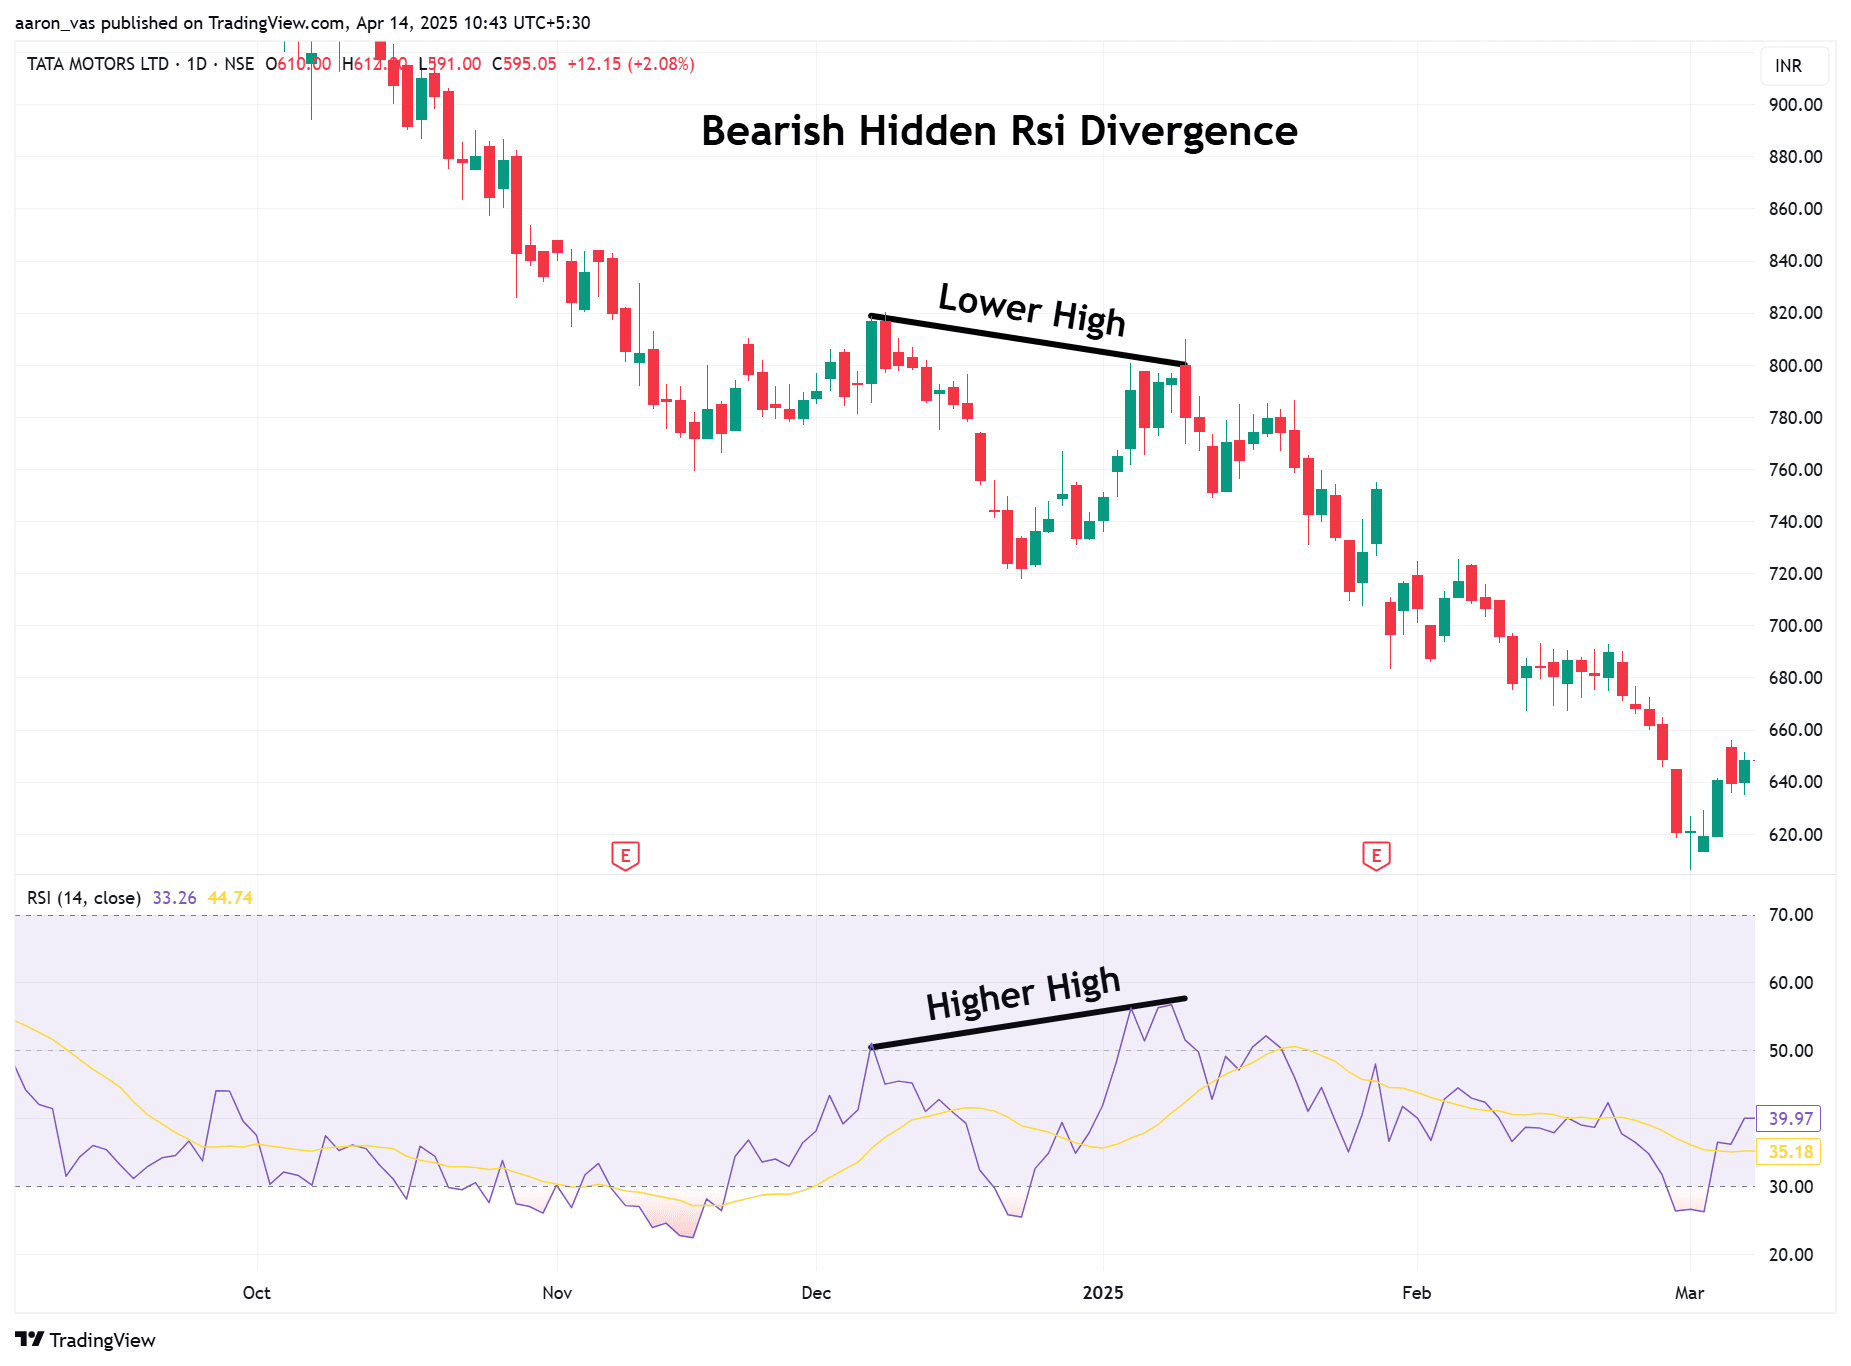
4) Bearish Hidden RSI Divergence
A hidden bearish RSI divergence occurs when the price of the security is making lower highs while moving in the downward direction, and the RSI indicator is making higher highs. This suggests that the sellers are still in control, and the security will likely continue to move in the downward direction.
How to trade:
Identification: The price of the security will form consecutive lower highs while the RSI will form higher highs during the same period.
Entry: Once the hidden bearish divergence is identified, look for additional confirmations and enter a sell/short position in the security.
Stop loss: The Stop-loss for this trade should be placed near the recent lower high of the hidden divergence
Profit Target: One can use the risk-to-reward ratio or previous support levels to determine the profit for a bearish hidden divergence trade.

Most Effective Time Frame For Identifying RSI Divergence
The use of the RSI divergence strategy is not restricted to any particular timeframe. However, the frequency and the effectiveness of the RSI divergence.
For instance, longer timeframes like the one-day chart will have fewer occurrences of the RSI divergence. But, as there is less noise in larger timeframes, the divergence tends to be more reliable, offering a stronger signal to the traders.
Conversely, on a shorter timeframe like the 15-minute chart, one can spot more RSI divergences. However, due to a lot of market noise, the accuracy of the RSI divergence will diminish.
RSI Divergence Cheat Sheet
Here’s an RSI divergence cheat sheet summarizing all 4 key divergence types along with their characteristics and typical trading implications.
Type | Price Action | RSI Behavior | Signal | Trend Implication |
Regular Bullish | Lower Low | Higher Low | Potential Uptrend Reversal | Bearish to Bullish Reversal |
Regular Bearish | Higher High | Lower High | Potential Downtrend Reversal | Bullish to Bearish Reversal |
Hidden Bullish | Higher Low | Lower Low | Trend Continuation | Bullish Continuation |
Hidden Bearish | Lower High | Higher High | Trend Continuation | Bearish Continuation |
Conclusion
RSI divergence is a powerful tool that helps traders identify early signs of trend reversals and continuations. Whether you're a beginner or an experienced trader, mastering the different types of divergences, regular and hidden, can significantly enhance your trading strategy. By combining RSI divergence with other indicators and proper risk management, you will be able to make more informed trading decisions and catch on to the trends across various timeframes.
If you're ready to start trading and put these strategies into practice, consider opening an intraday trading account with Rupeezy for a smooth and easy trading experience.
FAQs:
Q1. Is RSI divergence reliable?
RSI divergence can be a reliable indicator. However, it should be combined with other technical tools and proper risk management strategies.
Q2. Does RSI divergence always work?
No, RSI divergence doesn't always lead to accurate predictions. Thus, it should be used in conjunction with other technical indicators and risk management strategies.
Q3. Why does RSI divergence happen?
RSI divergence occurs when the momentum indicated by RSI doesn't align with price movements, signaling potential trend reversals or continuations. ?
Q4. Can I trade solely on RSI divergence?
While the RSI indicator is an effective trading tool, it should be used in combination with other technical tools in order to get the best results
Check Out These Related Articles |
The content on this blog is for educational purposes only and should not be considered investment advice. While we strive for accuracy, some information may contain errors or delays in updates.
Mentions of stocks or investment products are solely for informational purposes and do not constitute recommendations. Investors should conduct their own research before making any decisions.
Investing in financial markets are subject to market risks, and past performance does not guarantee future results. It is advisable to consult a qualified financial professional, review official documents, and verify information independently before making investment decisions.

Open Rupeezy account now. It is free and 100% secure.
Start Stock Investment


All Category