Best RSI Strategy for 2026: Guide to Master Trading with RSI


00:00 / 00:00
From the introduction of candlestick over a century ago, technical analysis has come a long way. Over the course of time, many great minds have come forward and introduced great indicators, that have further enhanced the field of technical analysis. One such tool is the RSI indicator introduced by J Wells Wilder. In this article, we will explore the best RSI strategy that one can employ while trading. So let's get started!
What is RSI
Relative Strength Index which is also termed as RSI is a leading indicator that was developed by J.Wells Wilder. It is a widely accepted momentum indicator used in technical analysis to measure the speed and magnitude of the change in the price of stocks or any other security.
This indicator oscillates between the range of 0 to 100 and helps to identify if the price of security is in the overbought or oversold condition. Furthermore, with the right of this indicator, one can determine if the price of the security is due for correction or a pullback.
Calculation of RSI
Although the calculation of the RSI indicator is embedded in the trading terminal, let us understand the math behind the working of the indicator
RSI= 100-[100/(1+RS)]
Here, the RS which is the relative strength is arrived at by dividing the average gain by the average loss
The average gain is the sum of the upward price changes over a given period (typically 14) divided by the number of periods to attain the average.
The average loss is the sum of downward price changes over the same period, divided by that same period.
Now that we understand how to calculate the RSI, let's explore the best RSI strategies we can use to improve our stock trading
Best RSI Trading Strategy 2026
1. Overbought and Oversold
Identifying the overbought and oversold zones is the most common RSI trading strategy used while trading. As discussed earlier, the RSI indicator oscillates between the range of 0 to 100.
When the RSI indicator moves below the range of 30, it is considered that the security is in the oversold zone. If the price of the security shows signs of reversal after a downtrend and the RSI moves above the 30 range, one can consider entering a long position in the security.
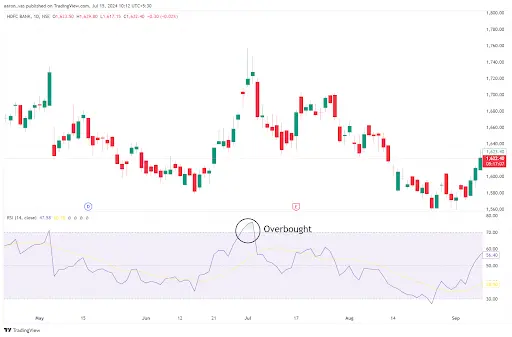
Similarly, when the RSI indicator moves above the range of 70, it is considered that the security is in the overbought zone. If the price of the security shows signs of reversal after an uptrend and the RSI moves below the 70 range, one can consider entering a short position in the security.
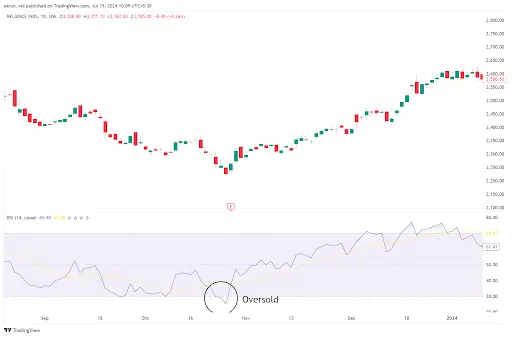
2. 50 crossover strategy
The 50 range in the RSI indicator is considered a neutral zone, where the security is neither overbought nor oversold. Traders can use this range in the RSI to confirm the ongoing trend in the market.
When the RSI indicator crosses above the range of 50 (from below 50) while the price is trending upward, it adds confirmation to the uptrend.
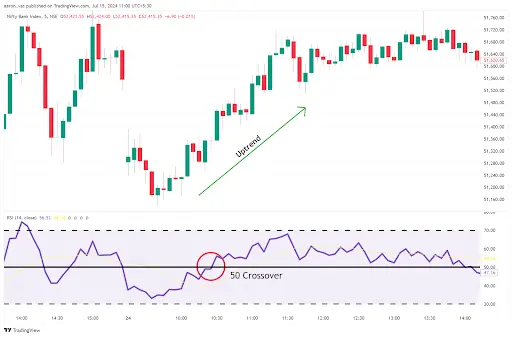
Similarly, when the RSI indicator crosses below the range of 50 (from above 50) while the price is trending downward, it adds confirmation to the downtrend.
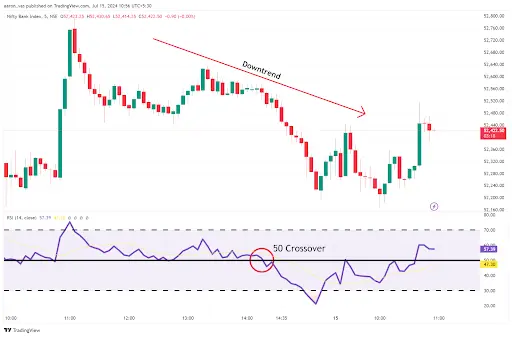
This RSI indicator strategy is a confirmation strategy rather than a trading strategy on its own. One should use this strategy along with the combination of other technical tools like moving averages or trendlines. Furthermore, strategy is more useful in a trending market rather than a choppy one
3. Divergence strategy
The price of the security and the RSI indication often follow similar movements. But when the RSI moves in the opposite direction of the price, this instance is known as a Divergence. This occurrence gives a strong indication of a pullback or correction in the security.
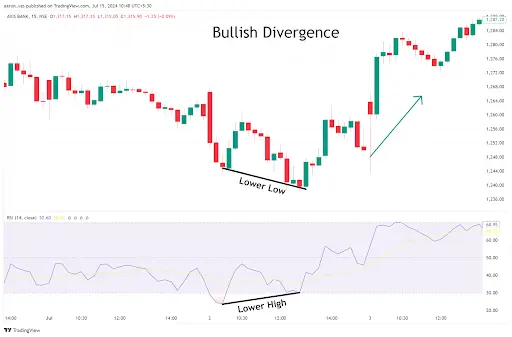
A bullish divergence occurs when the price of a security is moving downwards along with making lower lows while the RSI indicator is making higher lows. These movements indicate an increasing bullish momentum where traders can enter a long position when the security shows signs of upward reversal.
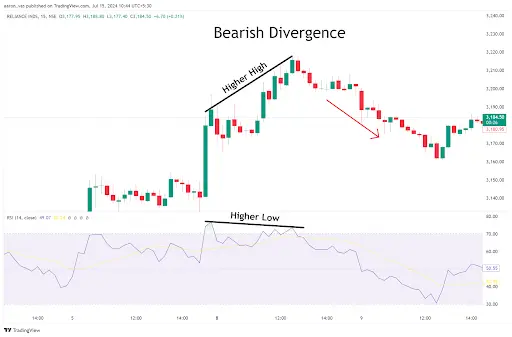
A bearish divergence occurs when the price of a security is moving upwards along with making higher highs while the RSI indicator is making lower highs. These movements indicate an increasing bearish momentum where traders can enter a short position when the security shows signs of a downward reversal.
Combing RSI with Moving average
So far, we have discussed strategies that are based on the RSI indicator alone. However, as the RSI cannot tell you the exact entry points, combining it with the moving average indicator can make identifying trades simpler.
Meanwhile, the RSI setting is set at a default of 14. The period of calculation for the moving average is based on the timeframe in which you are trading. Suppose, you are trading on a shorter timeframe, you would be required to use a shorter period moving average while requiring a longer period moving average for larger timeframes
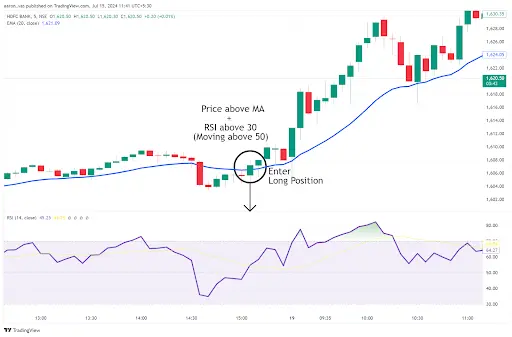
In this strategy, if the price has moved above the moving average and the RSI is above the 30 range, one can enter a long position in the security while placing a stop loss a few points below its entry level. Here, traders can book their profits when the price closes below the moving average.
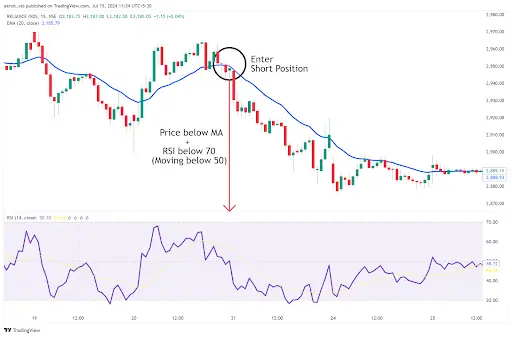
Similarly, if the price has moved below the moving average and the RSI is below the 70 range, one can enter a short position in the security while placing a stop loss a few points above its entry level. Here, traders can book their profits when the price closes above the moving average.
Limitations of RSI Indicator Strategy
While RSI has multiple trading strategies, it comes with its own set of drawbacks.
While the RSI indicator if a security is in an overbought or oversold zone, it does not tell you at what point the security may reverse. The security may reach the overbought or oversold zone, and they may continue to remain in those zones for an extended period without a sign of reversal. Therefore, it is not recommended to solely trade relying on this indicator.
while the indicator may give you signs of reversal or pullback in the stock, the size of the reversal is unknown. These reversals can be very minor after the occurrence of which, the security may continue to move in the direction of the prior trend.
Conclusion
Now that we've discussed some of the best RSI strategies, it's important to note that while the RSI indicator is great for spotting pullbacks and reversals, it can sometimes give false signals because it's a leading indicator. So, it's a good idea to use the RSI along with other technical tools to get better signals in the market.
If you're ready to start trading and put these strategies into practice, consider opening an intraday trading account with Rupeezy for a smooth and easy trading experience.
The content on this blog is for educational purposes only and should not be considered investment advice. While we strive for accuracy, some information may contain errors or delays in updates.
Mentions of stocks or investment products are solely for informational purposes and do not constitute recommendations. Investors should conduct their own research before making any decisions.
Investing in financial markets are subject to market risks, and past performance does not guarantee future results. It is advisable to consult a qualified financial professional, review official documents, and verify information independently before making investment decisions.
Open Rupeezy account now. It is free and 100% secure.
Start Stock InvestmentAll Category


