Guide To Calculating and Using Exponential Moving Average (EMA)


00:00 / 00:00
What Is Exponential Moving Average (EMA)?
Exponential Moving Average (EMA) is one of the essential technical indicator used widely by traders and investors .
Exponential Moving Average (EMA) gives more weighting to recent price data compared to Simple Moving Average (SMA) .
EMA is quite similar to SMA as it helps traders to measure trend direction of any security thus helps in predicting the future trend . Essentially its a trend direction indicator .
(EMA) is used to know long-term trends. EMA gives more accurate recent price action compare to SMA .
This is because EMA uses the latest data point and the oldest data point gets the least observation .
If you do not know about SMA and its calculation read our article on same . This will help you to clear fundamentals of (MA) Moving Averages .
How to calculate Exponential Moving Average (EMA)
You do not need to calculate EMA by yourself as most of the technical analysis software lets us drag and drop the EMA . This is just good to know info .
- First calculate the SMA
SMA = A1?+A2?+…+An / n
?? Where An?= the price of an asset at period n
n= the number of total periods?
- Than calculate the multiplier for weighting the EMA
Weighted multiplier? =2÷(selected time period+1)
selected time period can be 10 day , 20 days , or 100 days depend upon your strategy .
- At end calculate the current EMA
EMA [today] = (Price [today] x K) + (EMA [yesterday] x (1 – K))
Where:
K = 2 ÷(N + 1)
N = the length of the EMA ( time period)
Price [today] = the current closing price
EMA [yesterday] = the previous EMA value
EMA [today] = the current EMA value
EMA generally uses the previous value of the EMA in its calculation. Therefore EMA includes all the price data within its current value.
Another key point is the more data points you use, the more accurate your EMA will be.
How to Use EMA for Trading

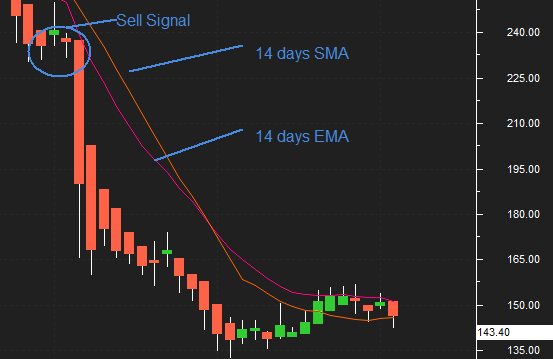
In the above chart of YES Bank Ltd. have plotted a 14 day SMA (orange) and a 14 day EMA (pink) on closing prices. Both SMA and EMA are for a 14 day period.
Additionally you can also notice that the EMA is following prices more closely than a corresponding SMA .
You can see a well established signal for selling occurred , when prices started falling below EMA & SMA .This is what you have to keep in mind .
As a trader opportunities will come its up to you how you capitalize them .

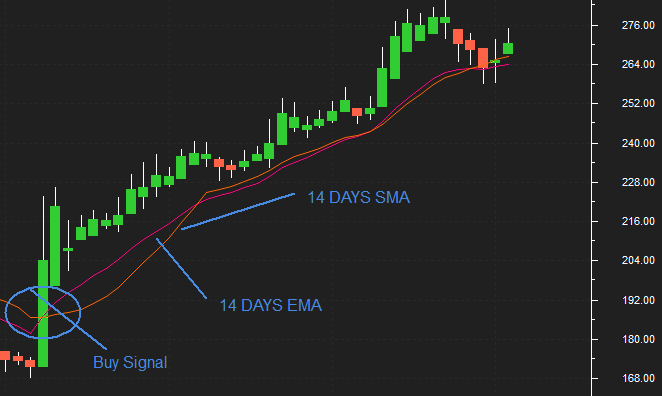
In the chart you can see how well a buying opportunity been given by EMA & SMA .
Its a huge rally that started happening when prices moved above the Moving Averages .
You can use both SMA & EMA for better & smooth signals .
Moving averages ensure that a trader is in line with the current trend. The trend is your friend and it is best to trade in the direction of the trend.
Important points to remember While Using EMA
- A falling EMA indicates that prices, on average, are falling. Hence this moving can be used to determine buying and selling opportunities in market .
- A rising moving average shows that prices are generally increasing. In other words one should look at buying opportunities.
- A long-term MA moving from a lower position to a higher one reflects a long-term uptrend.
- A long -term plunging MA , moving from a higher to a lower level reflects a long-term downtrend.
- EMA is also more vulnerable & get exposed as EMA reacts faster when the price is changing direction . To put it another way It may give you false or fake signals .
- A trader might use crossovers of the 50 EMA by the 10 or 20 EMA as trading signals.
- The most generally used EMAs by traders are the 5, 10, 12, 20, 26, 50, 100, and 200.
- Where as the 50, 100 and 200 EMAs are considered to be useful for longer-term trend trading .
Conclusion
Whichever tools and indicators you are using for your trading and investing purpose, make sure you have basic understanding of them.
Once you start using it you will eventually know through experience, if a signal is false or does it really a buy or sell.
In sideways market these indicators may give fake signals. Another key point is to put your stop loss at place and wait patiently .
We will be learning about more technical indicator and tools in forthcoming days .
Till than try to use any of the strategy and share your experience with us in comment box below.
The content on this blog is for educational purposes only and should not be considered investment advice. While we strive for accuracy, some information may contain errors or delays in updates.
Mentions of stocks or investment products are solely for informational purposes and do not constitute recommendations. Investors should conduct their own research before making any decisions.
Investing in financial markets are subject to market risks, and past performance does not guarantee future results. It is advisable to consult a qualified financial professional, review official documents, and verify information independently before making investment decisions.
Open Rupeezy account now. It is free and 100% secure.
Start Stock InvestmentAll Category


