A Comprehensive Guide to Support and Resistance in Intraday Trading


00:00 / 00:00
If you are a day trader or want to do intraday trading in market first thing to remember is Support and Resistance .
The Concept of support & resistance possibly the most important aspect of technical analysis in market .
Most of the technical analyst uses this to make entry and exit while trading in market. Today we will be learning how you can do intraday trading with help of support and resistance .
We are living in Era of technology hence there is no need of manual calculation of this points . The trading terminal where you perform trades will provide you with the option to calculate automatically.
However we will be discussing the formula later on . To illustrate let us discuss this one by one .
What is Support

Support is a price level of a stock where there will be more buyers than sellers . Whenever any stock start falling S1 or support level 1 is the first price level where you will see halt or pause .
It does not mean at all that price would sustain there and than move in upward direction . The price of a stock depends upon the trend .
If there is downtrend than at S1 it will stop for a while and than fall eventually . The reason for any stock to move upwards from it support is rise of demand due to falling share price .
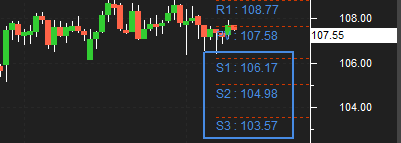
In the chart above you can see a rectangle with values return S1,S2,S3 . These are different support level for any stock .
Whenever the price of a stock falls to any of this level , it is very likely to bounce back . You can easily see there is a candle (type of chart) which did came because of fall in price and at around Rs.106 .50 it went up from there .
With this in mind one can try entering at this levels for a trade and take benefit of rise .
As we can see in chart Rs.107.55 is the current market price of a stock and down there there are different support levels .
Most of traders have a firm belief on support and resistance , they assume that price would make a reversal from this level . Hence one of the basic trading method using support is to buy near support in uptrend .
What is Resistance

The word resistance itself describe the whole story , it means to stop something . We learned support previously similar to that is resistance .
The different level of resistance stops the stock from moving further upwards . The moment a stock hit the R1 level similar to support it will halt for sometime ,depending up on the trend it will settle in that direction .
Either it may go upward or downward . The reason for any stock to move downward from it resistance level is due to heavy sell-off at rising price .
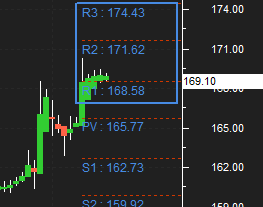
Mostly the sellers trade at this level ,it is a trigger point for them . In the chart above the current market price (CMP) of stock is Rs.169.10 which means it has hit the first level of resistance .
Another key point over here is consolidation of price and its movement ,candlestick chart reflect the price consolidation at R1 .
There are 4 hourly candles at Rs.168.60 to Rs. 169.50 , it means the price is not moving upwards due to resistance .
Based on this any trader can apply the strategy. when a trader is long(or bought shares) he can look at resistance points to set targets and to set exit points for the trade.
When a stock price hits the R1,R2 or R3 the price may eventually break through it, although the price would try to sustain at this level a number of times before doing so.
Point to remember : Buying near support or selling near resistance can yield good results , but there is no guarantee that the support or resistance will hold .
How to trade at Support & Resistance In Intraday

Till now we have tried to understand basics of support and resistance in intraday trading . Please note that support and resistance keep on changing everyday .
The one we have discussed above is only for intraday trades .Long term Support & Resistance is useful for swing trading where as Short term Support & Resistance is useful intraday and BTST (buy today sell tomorrow) trades .
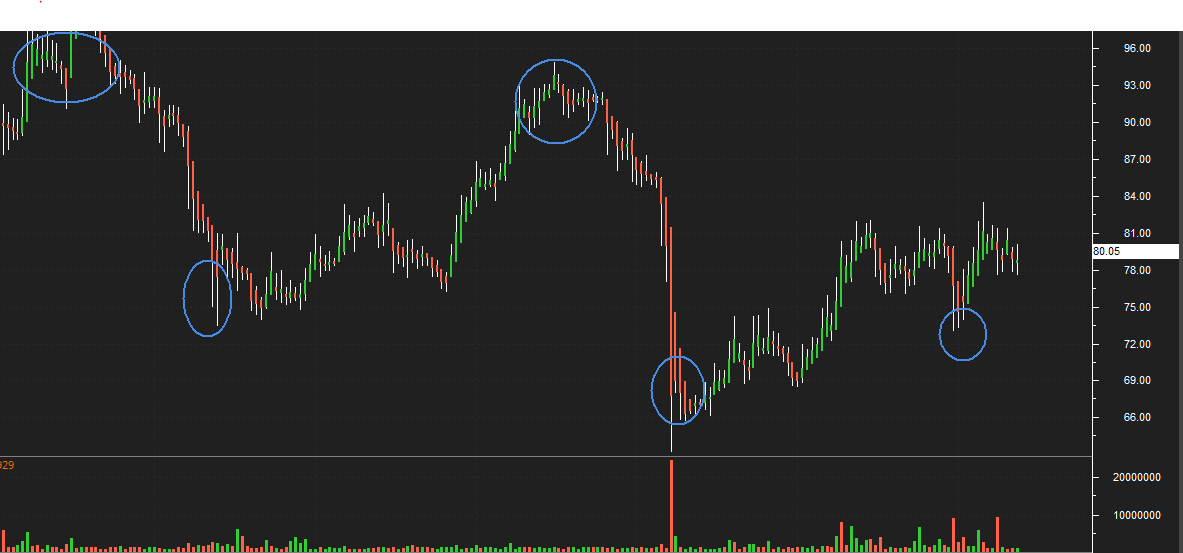
Above we have used 12 month chart to know different support and resistance level in last 1 year for Karur vysya bank .
As you can see there is major resistance at Rs. 90 -100 and support is @ Rs. 65 -75 . You can consider this price for entry or exit position in case of short term trading perspective .
Although you can use 24 to 60 months chart as well , to better understand and draw conclusion regarding the support and resistance .
furthermore whenever you buying at support wait for the consolidation to happen and check if it breaking the support level or holding it .
Similarly for resistance too if selling wait for consolidation to begin any trade . Sometime the stock may make false breakouts i.e stock prices will often move slightly further (higher or lower) than we expect them to move.
This doesn’t happen all the time, but when it does it is called a false breakout. Do not get trap in this eventually it will come to S&R level after some time .
For instance if a stock currently trading at Rs. 100 and S1 is Rs 97 , if it start falling than it may come down below Rs.97 to Rs. 96.10 or above Rs.97 to Rs. 97.45 .
Whatever it comes to it will wait there for consolidation before deciding the direction . Same goes for resistance also . S&R are areas not exact price so expect some variability in price movement around it .
S&R can be used to identify targets for the trade. When you are buying stock (For a long trade), look for the immediate resistance level as target.
For selling stock (short trade ), look for the immediate support level as target. I am referring target here as the point, when you will exit the trade and book your profit .
This was all about support and resistance for now , we will be discussing about various technical indicators and charting style in upcoming blogs .
Keep learning the more you know the chances of you becoming a success will be much higher .
The content on this blog is for educational purposes only and should not be considered investment advice. While we strive for accuracy, some information may contain errors or delays in updates.
Mentions of stocks or investment products are solely for informational purposes and do not constitute recommendations. Investors should conduct their own research before making any decisions.
Investing in financial markets are subject to market risks, and past performance does not guarantee future results. It is advisable to consult a qualified financial professional, review official documents, and verify information independently before making investment decisions.
Open Rupeezy account now. It is free and 100% secure.
Start Stock InvestmentAll Category


