Stock Market Crash: History, Causes, and What to Do When Markets Fall
 Rupeezy blog banner for stock market crash article
00:00 / 00:00
Last updated: 23 March 2026
On March 19, 2026, Indian investors witnessed the worst single-day crash in 22 months. The Sensex plunged 2,497 points in a single session, the Nifty 50 broke below 23,000 to close at 23,002, and ₹13 lakh crore of investor wealth was wiped out — all in one day. The trigger? A perfect storm of the US-Iran war, crude oil surging past $112 a barrel, HDFC Bank's chairman resigning over ethics concerns, and foreign investors dumping over ₹88,180 crore worth of Indian equities in March alone.
But here's the thing — this wasn't the first time. India's share market has crashed and fallen multiple times over the past three decades, from the Harshad Mehta scam of 1992 to the COVID panic of 2020. Every time the stock market falls, investors panic — and every single time, the market recovered and went on to make new highs.
This guide covers everything you need to know about stock market crashes and share market falls in India — why the stock market is falling today, what causes markets to crash, how bad past crashes have been, what's happening right now in March 2026 (including the HDFC Bank shock, the Iraq force majeure, and the rupee hitting 93.71), and most importantly, what you should do when the market is down.

What Is a Stock Market Crash?
A stock market crash (also called a share market crash or market fall) is a sudden and sharp decline in stock prices across a significant section of the market. When the stock market falls 20% or more in a short period, it's classified as a crash. It typically happens over a few days or weeks and is driven by panic selling, where investors rush to exit their positions at the same time.
But not every stock market fall is a crash — sometimes the market is just correcting. Here's how to tell the difference (also read our detailed guide on stock market corrections):
| Term | Definition | Typical Decline | Duration |
|---|---|---|---|
| Correction | A healthy pullback after a rally | 10–20% from recent high | Weeks to a few months |
| Crash | A sudden, panic-driven collapse | 20%+ in days or weeks | Days to weeks |
| Bear market | A prolonged period of declining prices | 20%+ sustained | Months to years |
A correction is normal — it happens several times a year. A crash is rare, driven by extreme fear, and often triggered by an unexpected event like a war, a financial scam, or a pandemic. A bear market is a long, slow grind downward, often following a crash.
The key difference: corrections are gradual and expected. Crashes are sudden and driven by panic.
What Causes a Stock Market Crash?
Stock market crashes and sharp market falls don't happen randomly. They're triggered by specific events that shake investor confidence and cause widespread selling. If you're wondering why the stock market is down today or why the share market is falling, here are the most common causes, with examples from India's history.
Geopolitical Crises
Wars, military conflicts, and sanctions create uncertainty in global markets. When the US and Iran escalated into open conflict in early 2026, India — which imports over 80% of its crude oil — was immediately hit. Brent crude crossed $112 per barrel, Iraq declared a force majeure at all oilfields operated by foreign companies, drones struck refineries in Kuwait, and the Strait of Hormuz — through which 20% of global oil flows — saw tanker traffic plunge. The Sensex lost over 10,000 points in March 2026 alone, and the Indian rupee crashed to a record low of 93.71 per dollar.
Financial Scams and Frauds
India has a history of market-shaking scams. In 1992, Harshad Mehta manipulated stock prices using ₹5,000 crore siphoned from banks, inflating the Sensex from 1,000 to 4,467 before the scam was exposed and markets crashed 72%. In 2001, Ketan Parekh ran a similar operation, artificially pumping "K-10" stocks using borrowed funds, leading to another sharp correction.
Global Economic Contagion
When major global economies crash, India follows. The 2008 Global Financial Crisis (GFC), triggered by the collapse of Lehman Brothers and the US subprime mortgage bubble, wiped out 50% of the Sensex's value in just 12 months. India wasn't directly involved in the subprime crisis, but foreign investors pulled out massively, dragging Indian markets down.
FII/FPI Selling Pressure
Foreign Institutional Investors (FIIs) and Foreign Portfolio Investors (FPIs) hold a significant chunk of Indian equities. When they sell in large volumes — whether due to global risk-off sentiment, a strengthening US dollar, or better returns elsewhere — Indian markets drop sharply. In March 2026 alone, FPIs pulled out ₹88,180 crore from Indian equities — the highest monthly withdrawal of the year, with ₹35,475 crore exiting in the third week of March. For 2026 year-to-date, the total FII outflow exceeded ₹1.04 lakh crore, with March accounting for more than half the year's total.
Overvaluation and Speculative Bubbles
When stock prices run far ahead of their actual earnings, a crash becomes inevitable. The dot-com bubble burst of 2000–2001 is a classic example — technology stocks globally were trading at absurd valuations with no real profits to back them up. When the bubble burst, it took Indian IT stocks down with it.
Central Bank Policy Shifts
When central banks raise interest rates aggressively to control inflation, borrowing becomes expensive, corporate profits shrink, and stock prices fall sharply. When the market falls due to rate hikes, it tends to affect growth stocks and banking stocks the most. The US Federal Reserve's aggressive rate hikes in 2022 triggered a global sell-off, and India wasn't spared.
Biggest Stock Market Crashes in India — A Timeline
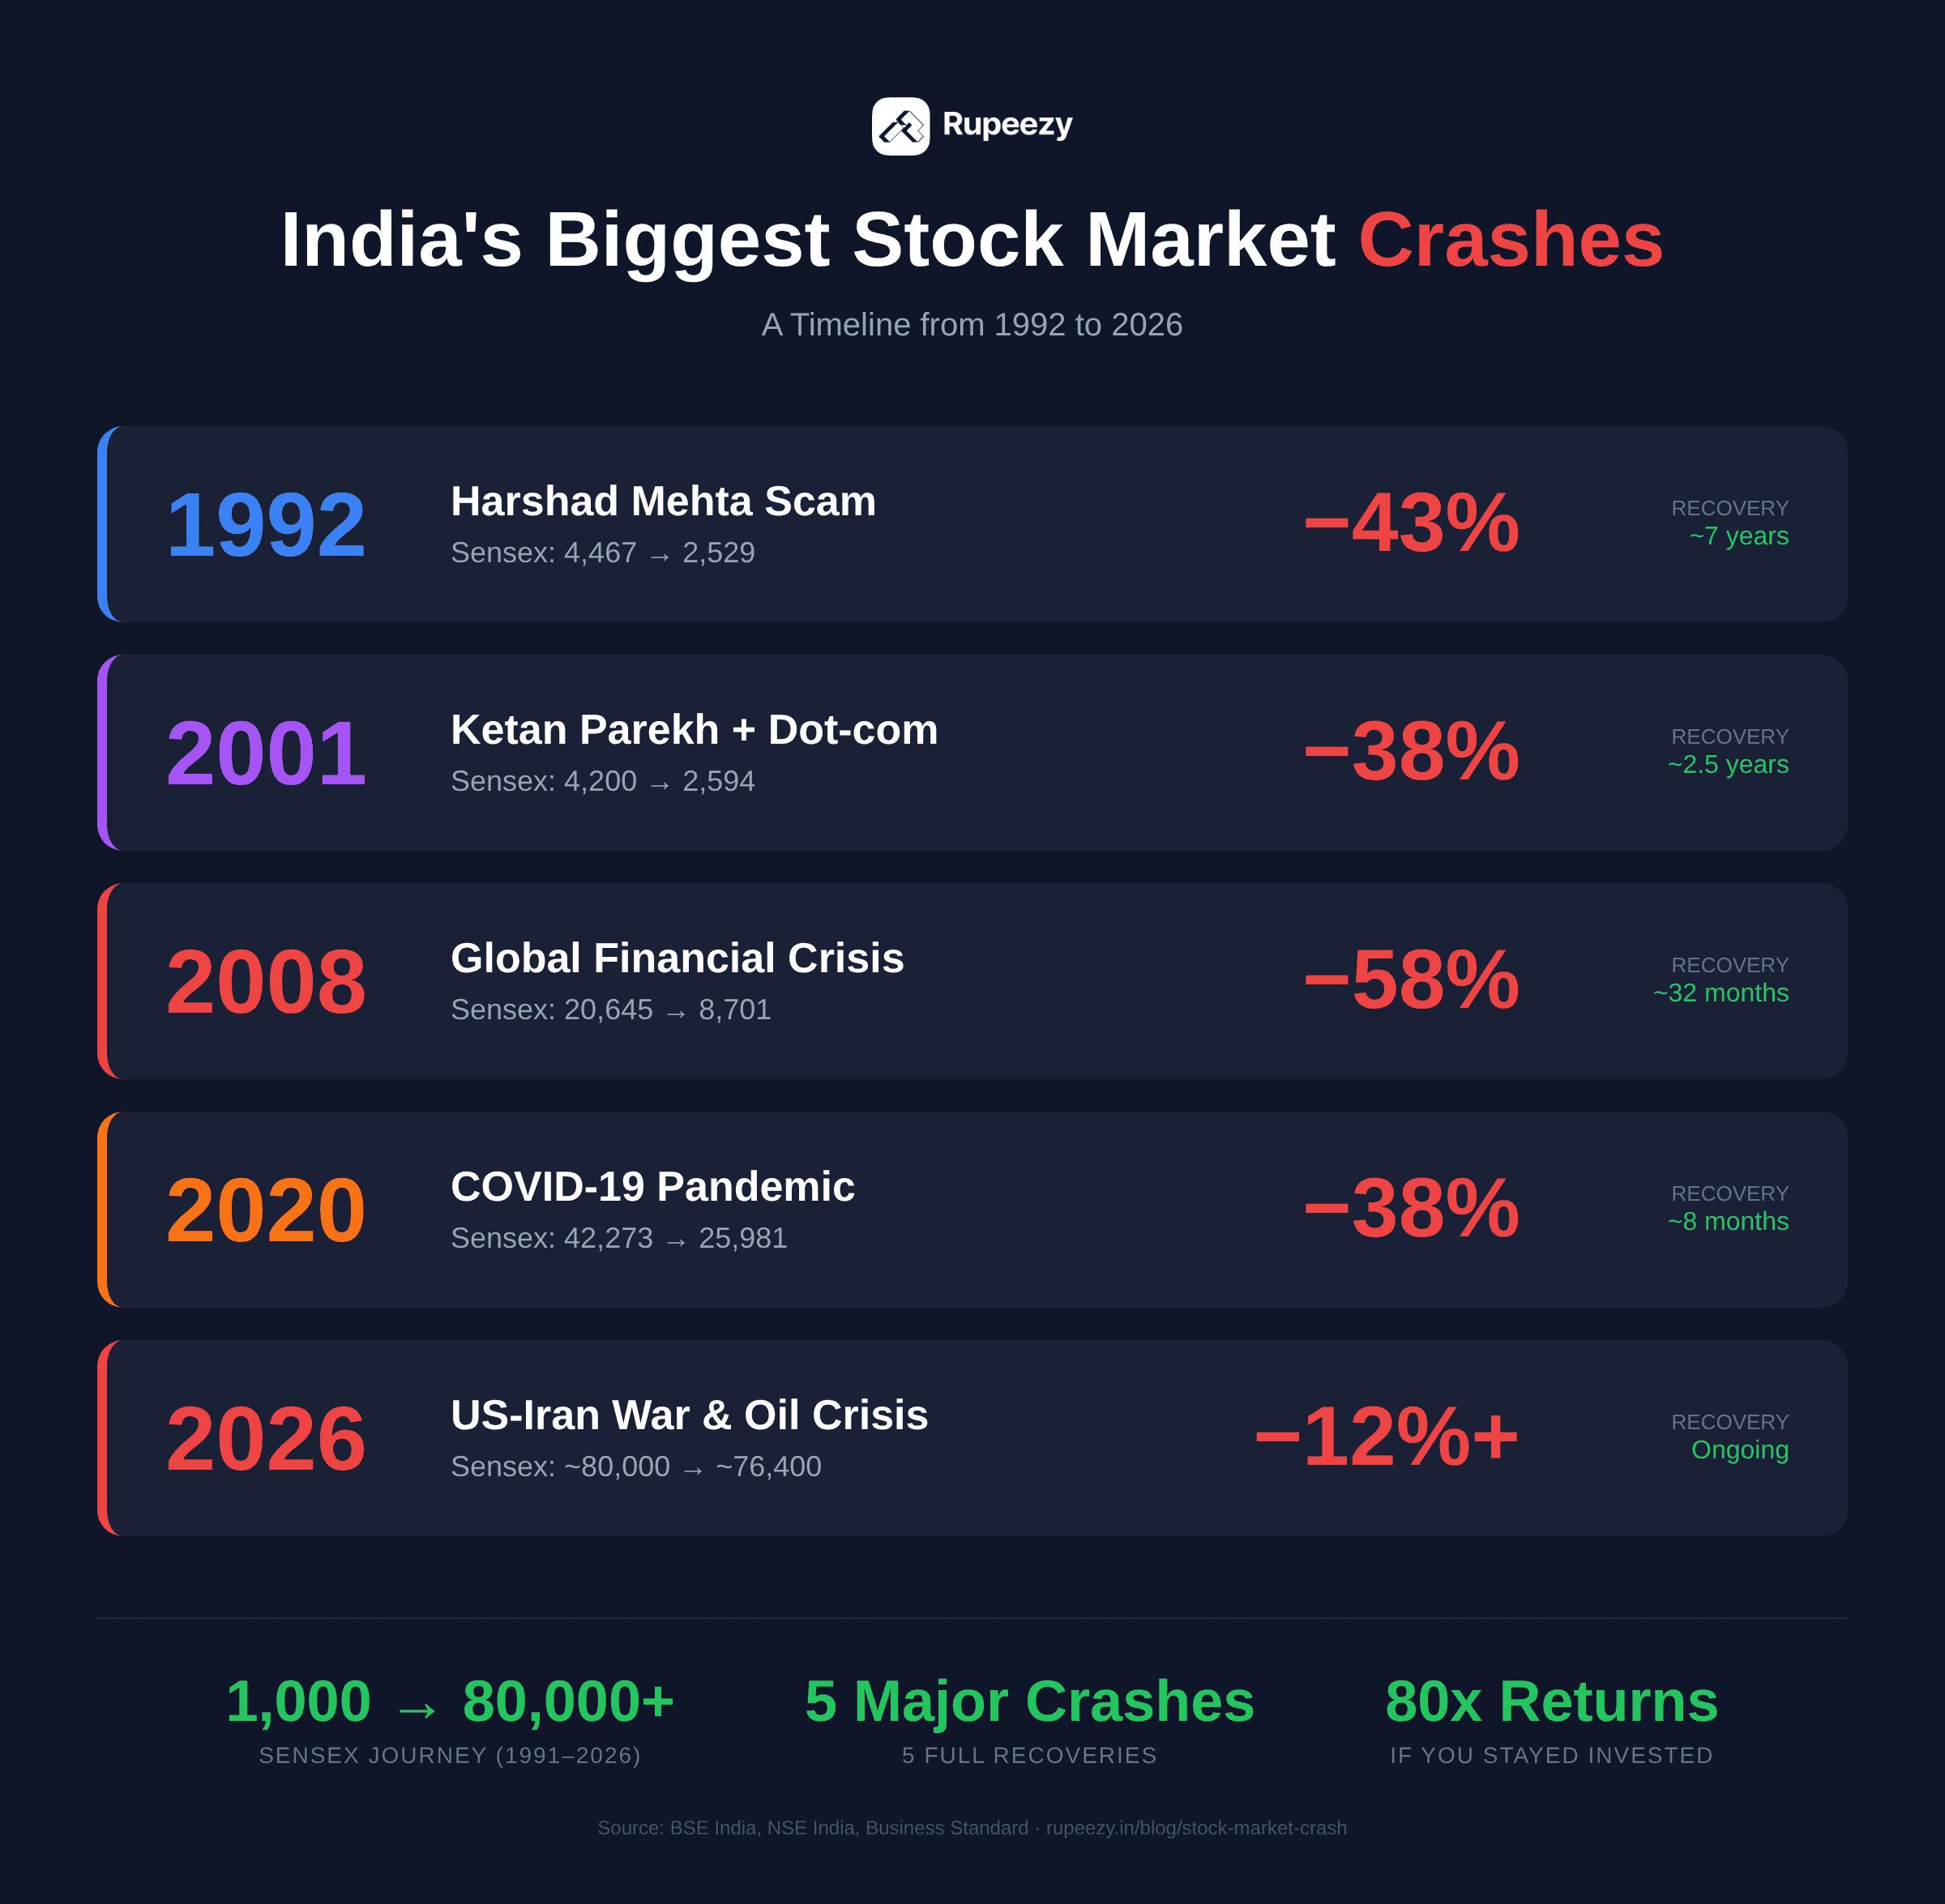
India's stock market has weathered five major crashes since the Sensex was formed. Each one felt like the end of the world at the time. None of them were.
1992 — The Harshad Mehta Scam
What happened: Harshad Mehta, a stockbroker nicknamed "The Big Bull," orchestrated India's biggest securities fraud. He siphoned approximately ₹5,000 crore from the banking system using fake bank receipts and ready-forward deals, and used this money to artificially inflate stock prices.
The crash: The Sensex had surged from around 1,000 in early 1991 to a peak of 4,467 on April 23, 1992. When journalist Sucheta Dalal exposed the scam in The Times of India on April 23, 1992, the market collapsed. On April 28, 1992, the BSE fell 12.77% in a single day. Over the following months, the Sensex crashed to 2,529 by August 1992 — a fall of over 43%.
Total damage: Stocks eventually dropped 72% from their inflated highs. The bear market lasted about 2 years.
Recovery: The Sensex didn't sustainably cross the 4,000 level again until 1999 — roughly 7 years later.
Key lesson: When prices are driven by fraud rather than fundamentals, the fall is steep and the recovery is slow.
2001 — The Ketan Parekh Scam + Dot-Com Bust
What happened: Ketan Parekh, a Mumbai stockbroker, manipulated prices of ten less-known stocks (called "K-10 stocks") through circular trading and borrowed heavily from banks including Madhavpura Mercantile Co-operative Bank. This coincided with the global dot-com bubble burst.
The crash: The Sensex fell from around 4,200 to 2,594 — a decline of about 38%. On March 1, 2001, just after the Union Budget, the Sensex crashed 176 points in a single session. Parekh was arrested on March 30, 2001, triggering further panic selling. The government estimated the fraud could be up to ₹40,000 crore.
Recovery: The Sensex took until late 2003 to recover past the 4,200 level — roughly 2.5 years.
Key lesson: Leveraged speculation always ends badly. When borrowed money drives prices up, the unwind is brutal.
2008 — The Global Financial Crisis
What happened: The collapse of Lehman Brothers and the US housing mortgage crisis triggered a worldwide financial meltdown. India, despite having no direct exposure to subprime loans, was dragged down by massive FII selling and global risk aversion.
The crash: The Sensex peaked at 20,645 in January 2008 and crashed to 8,701 by October 24, 2008 (understand more about how recessions work) — a fall of nearly 58%. On January 21, 2008 alone, the Sensex dropped 1,408 points. By March 2009, it was still hovering around 8,000–9,000. Over ₹25 lakh crore of investor wealth was destroyed.
Recovery: The Sensex recovered to 20,000 by September 2010 — roughly 32 months (about 2.5 years) from the bottom. 2009 was a spectacular recovery year with the Sensex gaining over 80%.
Key lesson: Even when India's fundamentals are strong, global contagion can pull markets down. But the recovery, when it comes, is equally powerful.
2020 — The COVID-19 Pandemic Crash
What happened: The World Health Organization declared COVID-19 a global pandemic in March 2020. Countries went into lockdown, economic activity froze, and fear of a global recession gripped markets.
The crash: The Sensex plunged from 42,273 to 25,981 in just weeks — a fall of 38%. On March 23, 2020, the Sensex crashed 3,935 points (13.15%) in a single session, and the Nifty fell 1,135 points (12.98%). Investors lost ₹13.88 lakh crore in that one week.
Recovery: This was the fastest recovery in Indian market history. By November 2020 — just 8 months later — the Sensex was back at 41,000. By September 2021, it had surged past 60,000, a 130% gain from the March 2020 low. Vaccine optimism, government stimulus, massive retail investor participation, and FII inflows fueled the rally.
Key lesson: The scariest crashes often have the fastest recoveries. Those who panicked and sold at the bottom missed one of the greatest rallies in Indian market history.
2026 — The US-Iran War and Oil Crisis (Ongoing)
What happened: The US-Iran military conflict, which escalated significantly in late February 2026, triggered a global energy crisis. Iran shut down the Strait of Hormuz, cutting off 20% of global oil supply. Iraq declared force majeure at all oilfields operated by foreign companies. Drones struck two refineries in Kuwait. Brent crude surged past $112 per barrel, with Goldman Sachs warning it could hit $150 if disruptions intensified. India, which imports over 80% of its crude oil, was among the worst-hit economies. Adding to the chaos, HDFC Bank's chairman Atanu Chakraborty resigned on March 18 citing “unethical practices,” wiping ₹65,000 crore off the bank's market cap in two sessions.
The crash (as of March 23, 2026): Here's a day-by-day timeline of how it unfolded:
| Date | Sensex Move | Nifty Level | Key Trigger |
|---|---|---|---|
| March 2 | Nifty fell below 25,000; broad market sell-off on global cues | Below 25,000 | War fears + FII selling |
| March 4 | Nifty fell ~500 pts; Sensex crashed 1,700+ pts in pre-open (post-Holi gap-down) | Below 24,350 | Crude crosses $100 |
| March 6 | Nifty fell ~440 pts to 24,450; Sensex fell 1,097 pts | 24,450 | Brent at $87.57, supply fears |
| March 9 | Nifty fell ~650 pts; sharp selloff across all sectors | ~23,800 | Iran closes Strait of Hormuz |
| March 13 | Nifty fell ~430 pts; Sensex crashed 1,460 pts | ~23,150 | Crude at $115, ₹9.5L cr wiped |
| March 18 | HDFC Bank chairman resigns | 23,776 (intraday rally) | Ethical concerns at India's largest private bank |
| March 19 | Sensex fell 2,497 pts (−3.26%); Nifty at 23,002 — worst single-day fall in 22 months | 23,002 | FII selling ₹10,717 cr; US–Iran tensions; crude spikes; ₹13 lakh cr wiped |
| March 20 | Markets fall further at open; Nifty hits 22,800 intraday low | ~22,800 | Panic selling; crude holds $112; circuit fears; FII outflows continue |
| March 23 | Nifty closes at 22,512.65 — third consecutive session in the red | 22,512.65 | Ongoing US–Iran tensions; crude $112–$115; FII outflows persist |
Key numbers (updated 23 March 2026): - Total Sensex fall in March: Over 11,000 points - FII/FPI selling in March: ₹88,180+ crore (highest monthly outflow of 2026) - FPI selling in third week of March alone: ₹35,475 crore - Single biggest FII exit day (2026): ₹10,717 crore (March 19) - Total FII outflow in 2026 (YTD): ₹1.04+ lakh crore - Rupee at record low: 93.71 per dollar (March 19) - Brent crude: ~$113–$115 per barrel (March 23) - Investor wealth destroyed on March 19 alone: ₹13 lakh crore - Year-to-date Sensex decline: Over 15%
Sectors worst hit: - Energy/Oil: Indian Oil, HPCL, BPCL slumped 7–8% (dependent on crude imports) - Banking: HDFC Bank lost 7% in 2 days after chairman exit; ICICI Bank, SBI dragged index - Aviation: IndiGo cracked 8%+ to a 52-week low (jet fuel costs) - IT: Global slowdown fears hit TCS, Infosys, Wipro - Metals & Auto: Hindalco, Tata Steel, Maruti fell 5–8%
Recovery: On March 20 (Friday), markets saw a brief intraday rebound with the Sensex gaining 960 points before paring gains. However, the relief was short-lived — by March 23 (Monday), selling resumed and Nifty closed at 22,512.65, a fresh low for this crash cycle. The rupee continues to hover near its record low of 93.71. Analysts caution that a sustained recovery requires either a crude price correction or an Iran-US de-escalation signal.
Key lesson: Geopolitical events, especially those affecting energy supply, can cause severe and extended market damage for import-dependent economies like India. Corporate governance shocks (like the HDFC Bank episode) can compound the damage during already fragile markets.

How Does India Protect Investors During a Crash?
India has built-in safety mechanisms to prevent runaway panic. The most important one is the circuit breaker system, implemented by SEBI in July 2001.
Market-Wide Circuit Breakers
When the Sensex or Nifty (whichever is breached first) moves by a certain percentage from the previous day's close, trading is automatically halted across all equity and equity derivative markets nationwide.
| Trigger Level | If Breached Before 1:00 PM | If Breached 1:00–2:30 PM | If Breached After 2:30 PM |
|---|---|---|---|
| 10% | Trading halted for 45 minutes | Trading halted for 15 minutes | No halt |
| 15% | Trading halted for 1 hour 45 minutes | Trading halted for 45 minutes | Trading halted for rest of day |
| 20% | Trading halted for rest of day | Trading halted for rest of day | Trading halted for rest of day |
These circuit breakers are calculated daily based on the previous day's closing index level. The trigger levels are applied to both upward and downward movements.
Additional Surveillance Measures
Beyond circuit breakers, SEBI and the exchanges use:
- ASM (Additional Surveillance Measure): Stocks with unusual price movements or trading volumes are placed under enhanced surveillance, with increased margin requirements.
- GSM (Graded Surveillance Measure): Stocks that show signs of manipulation are placed in stages of increasing restrictions, from Stage 1 (trade-to-trade basis) to Stage 6 (suspension of trading).
SEBI's Role
SEBI actively monitors market activity during periods of extreme volatility. It can impose additional margins on futures and options, restrict short selling, and investigate for manipulation. During the March 2026 crash, SEBI has been closely monitoring FII activity patterns and derivatives positions.
What Should You Do During a Stock Market Crash?
This is the most important section of this article. When the stock market is down and the share market is falling, knowing what to do is what separates informed investors from panicked ones.
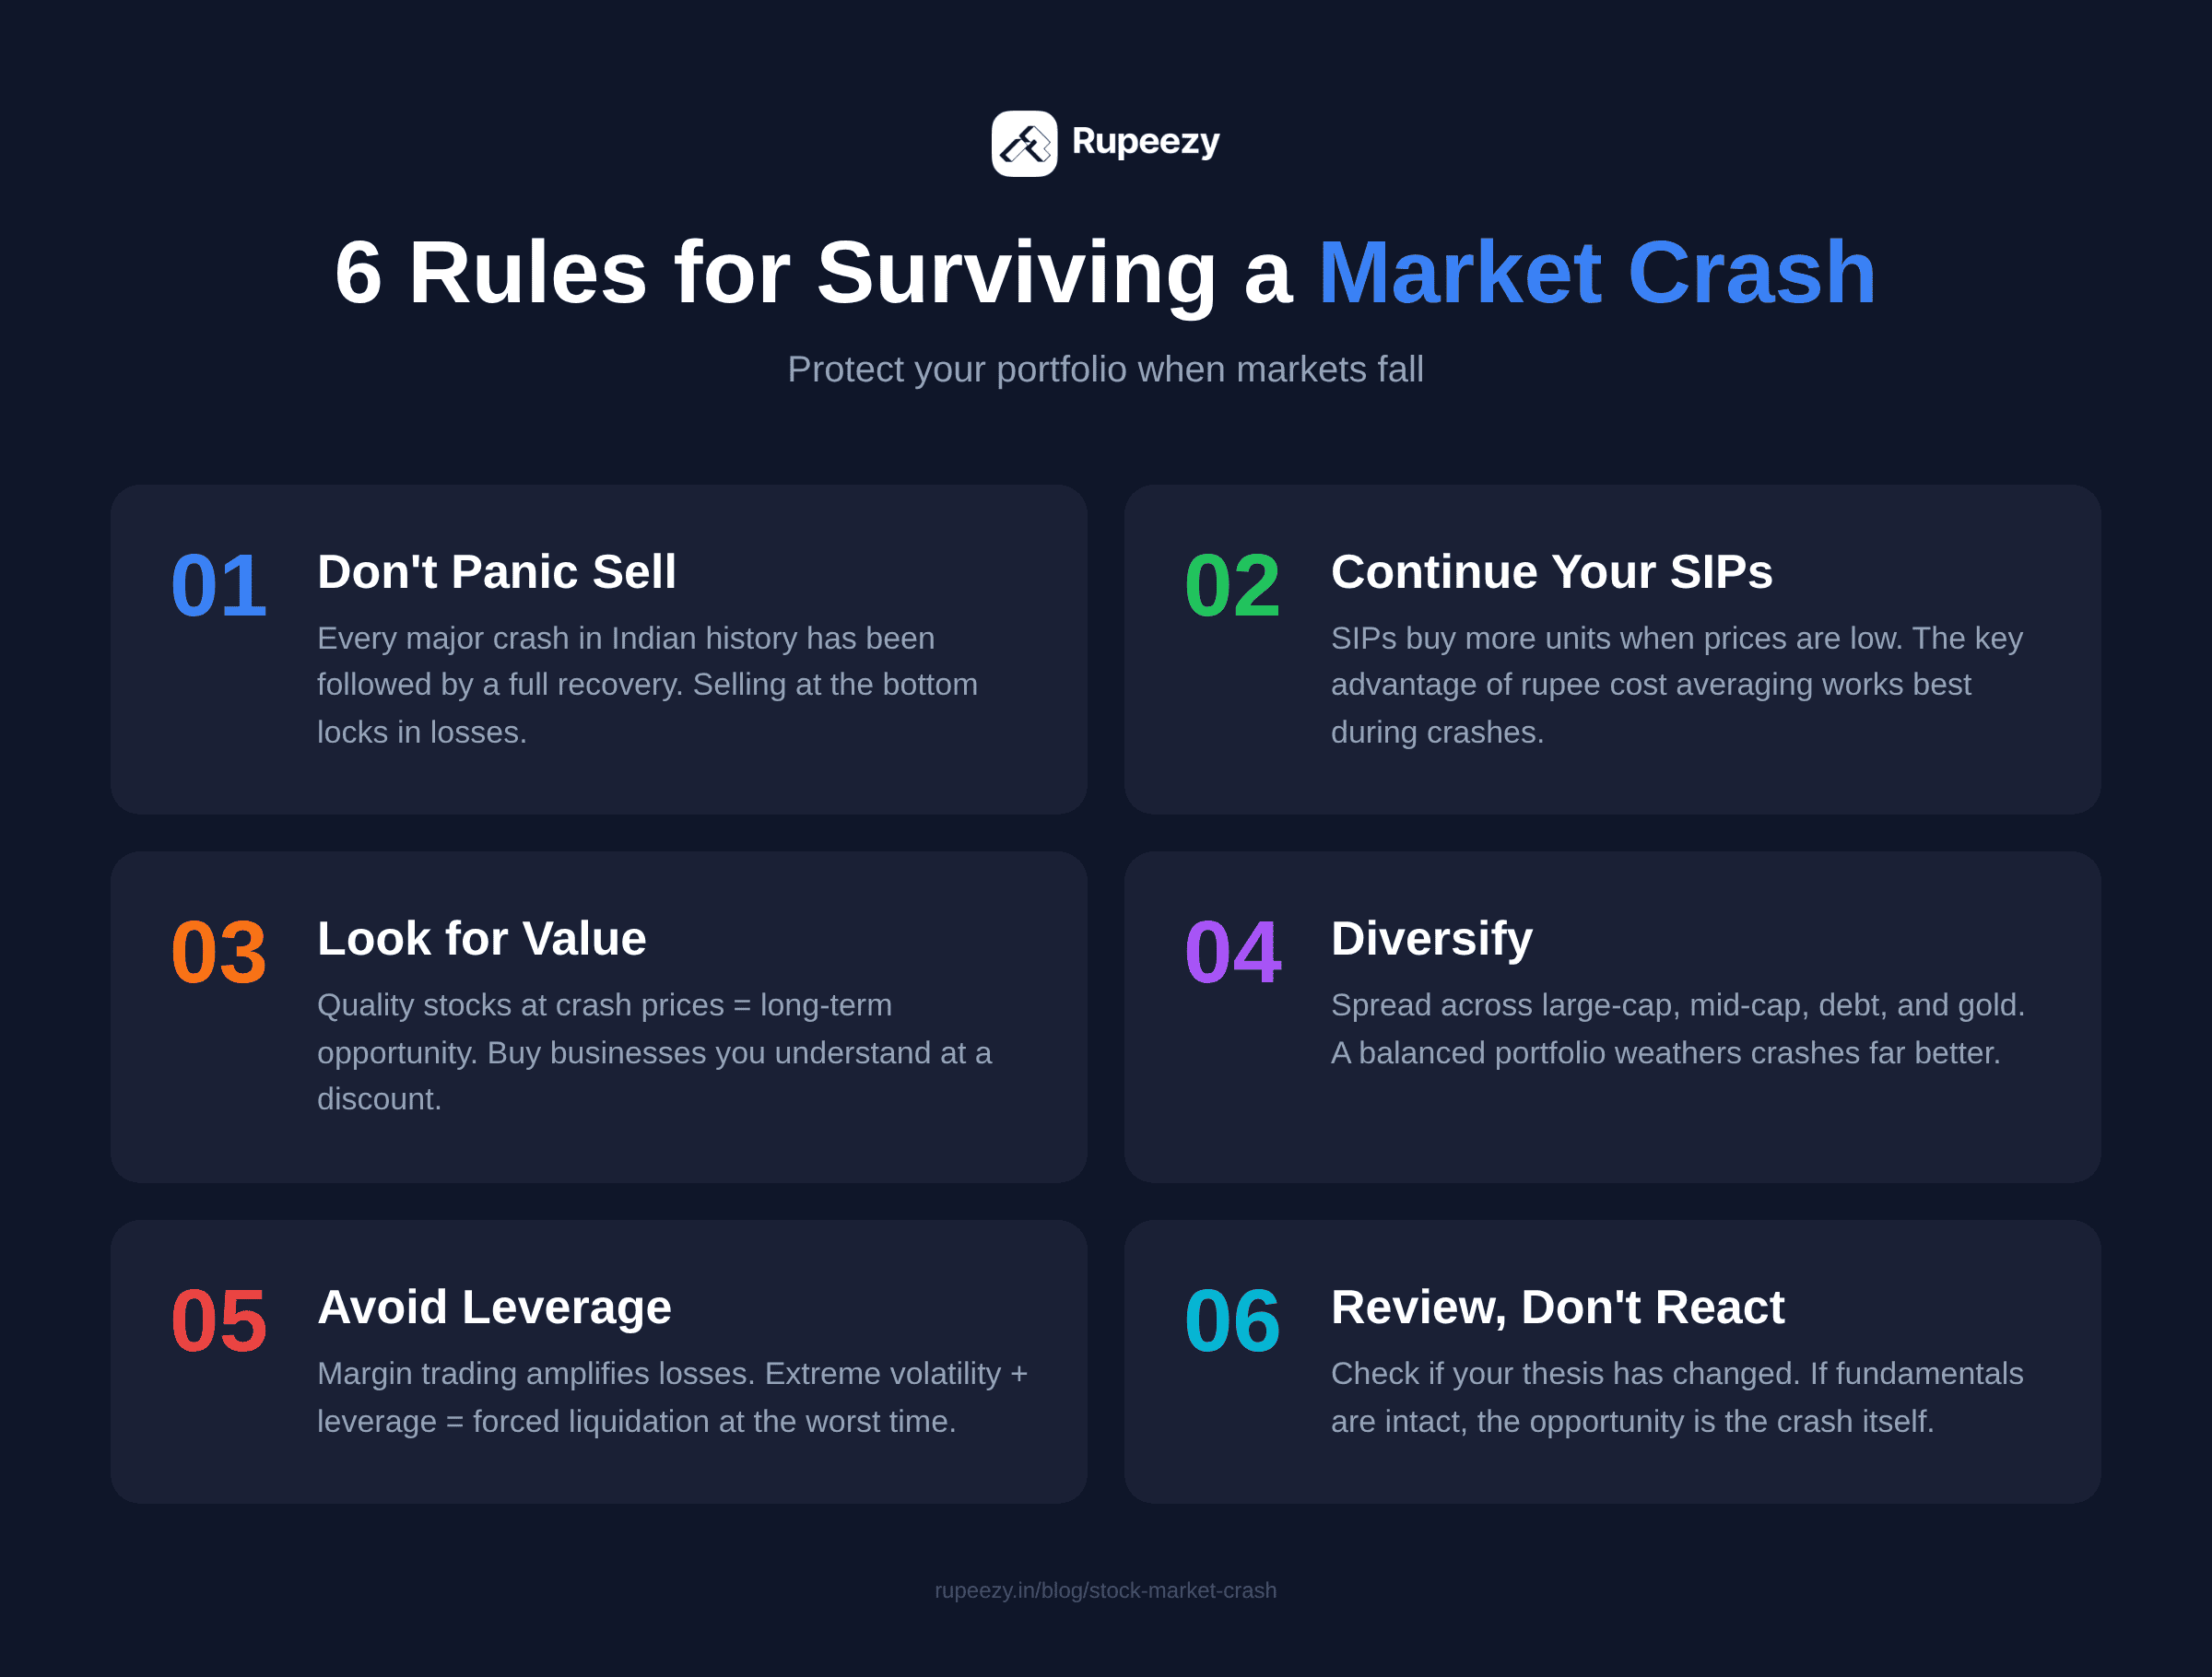
Don't Panic Sell
This is rule number one. Every major crash in Indian history has been followed by a full recovery and new highs. Investors who sold during the 2020 COVID crash at Sensex 25,981 missed the rally to 60,000+. Those who sold during the 2008 GFC at Sensex 8,700 missed the rally to 20,000 within 2.5 years.
Panic selling locks in your losses permanently. Holding through the pain doesn't.
Continue Your SIPs
If you have Systematic Investment Plans (SIPs) running in mutual funds, do NOT stop them during a crash. In fact, crashes are when SIPs work best. Here's why: SIPs buy more units when prices are low (rupee cost averaging). The units you buy during a crash become your biggest profit generators when the market recovers.
Historical data proves it: investors who continued SIPs through the 2008 and 2020 crashes earned significantly higher returns over 5–10 years compared to those who paused.
Mutual fund investments are subject to market risks. Read all scheme-related documents carefully before investing.
Look for Value
A crash brings quality stocks to attractive valuations. Companies with strong fundamentals — consistent profits, low debt, growing revenue — don't become bad companies just because their stock price fell. If a stock you've been watching at a P/E of 30 is now available at 15, that's the market giving you a discount.
But be selective. Not every fallen stock is a value buy. Some stocks fall because the company genuinely has problems.
Diversify Your Portfolio
If a crash exposes that 80% of your portfolio is in one sector or one asset class, that's a signal to diversify. A well-balanced portfolio across large-cap, mid-cap, debt, and gold tends to weather crashes better than a concentrated equity portfolio. Consider adding gold ETFs as a hedge during volatile periods.
Avoid Leverage During Crashes
This is critical. Do NOT take margin positions (MTF), buy futures, or use any form of leverage during extreme market volatility. Leverage amplifies both gains and losses. During a crash, it can wipe out your entire capital — not just your profits.
If you already have leveraged positions, consider reducing them to a manageable level.
Review, Don't React
After the initial panic subsides, review your portfolio fundamentals — not the daily NAV. Ask yourself: - Have the companies I own changed fundamentally? (Are revenues still growing? Is management still competent? Is debt under control?) - Or has only the stock price changed?
If the fundamentals are intact, hold. If the fundamentals have deteriorated (e.g., a company directly affected by the crisis), consider exiting once markets stabilize — not during the panic.
How Do Markets Recover After a Crash?
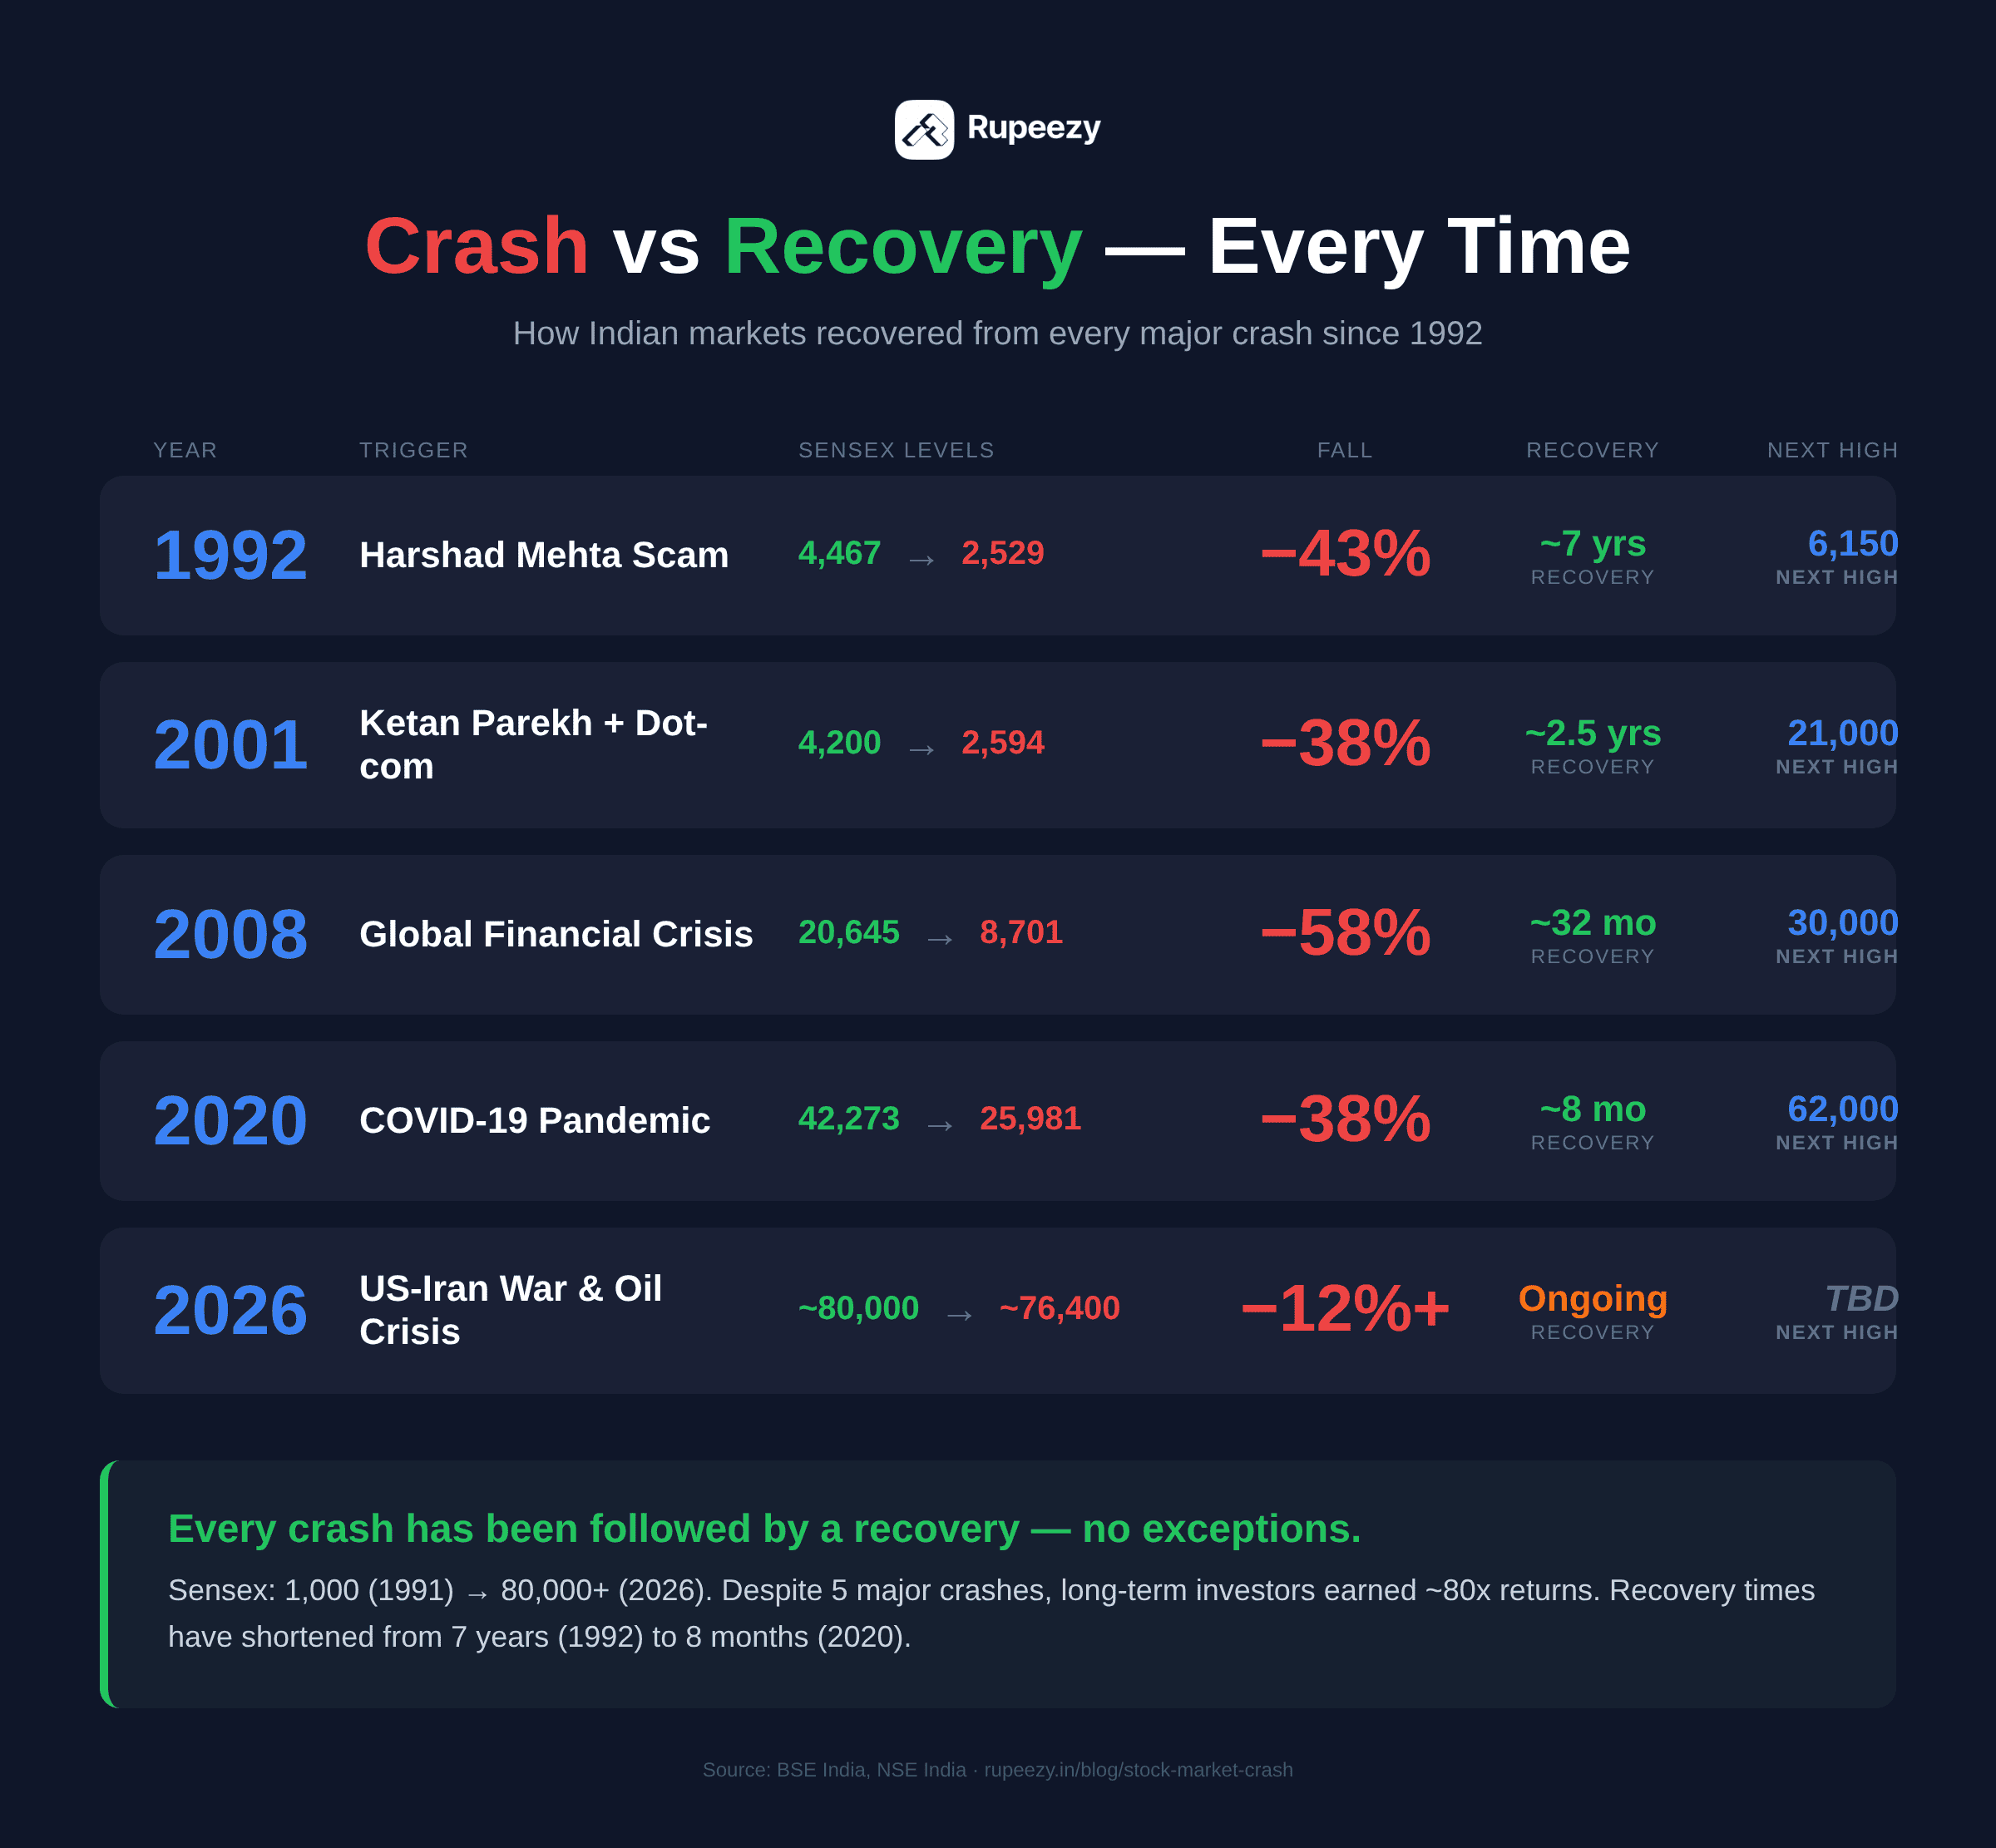
Every single stock market crash in Indian history has been followed by a recovery. No exceptions.
| Crash | Trigger | Sensex Peak | Sensex Bottom | Fall % | Recovery Time | Next Major High |
|---|---|---|---|---|---|---|
| 1992 | Harshad Mehta scam | 4,467 | 2,529 | -43% | ~7 years | 6,150 (2000) |
| 2001 | Ketan Parekh + dot-com | 4,200 | 2,594 | -38% | ~2.5 years | 21,000 (2008) |
| 2008 | Global Financial Crisis | 20,645 | 8,701 | -58% | ~32 months | 30,000 (2015) |
| 2020 | COVID-19 pandemic | 42,273 | 25,981 | -38% | ~8 months | 62,000 (2021) |
| 2026 | US-Iran war + oil crisis + HDFC shock | ~80,000 | ~73,100* | ~15%+ | Ongoing | TBD |
*Crash ongoing. Nifty closed at 22,512.65 on March 23 (current low); Sensex ~73,100 on March 23. March 19 Nifty: 23,002; Sensex: ~74,207.
The pattern is clear: the Sensex was at 1,000 in 1991. Despite five major crashes, it was above 80,000 by early 2026. An investor who simply held a Sensex index fund through all of these crashes would have earned approximately 80x returns in 35 years.
The lesson isn't that crashes don't hurt — they do. The lesson is that recoveries always come, and they reward patient investors disproportionately.
FAQs
What is a stock market crash? A stock market crash is a sudden, rapid decline in stock prices — typically 20% or more — that happens over a few days or weeks. It's caused by panic selling, usually triggered by an unexpected event like a war, financial crisis, or pandemic.
Why did the stock market crash today (March 2026)? The Indian stock market crashed in March 2026 due to multiple compounding factors: the US-Iran war pushed crude oil past $112/barrel, Iraq declared force majeure at all foreign-operated oilfields, and drones struck Kuwait refineries. HDFC Bank's chairman resigned citing “unethical practices,” wiping ₹65,000 crore off the bank alone. FPIs pulled out ₹88,180 crore in March — the highest monthly outflow of the year. The rupee hit a record low of 93.71/USD, and ₹13 lakh crore was wiped out on March 19 alone — the worst single-day fall in 22 months.
Why is the share market falling today? The Indian share market is falling today (23 March 2026) due to continued escalation of the US-Iran war and its impact on global oil supply. Brent crude remains at $112–$115, FIIs are continuing to dump Indian equities, and the US Fed has signalled rates will stay at 3.75% — dashing hopes of a rate cut. Nifty closed at 22,512.65 on March 23 — the third consecutive session in the red. Banking, energy, aviation, and IT stocks are the worst hit sectors.
What are the biggest stock market crashes in India? India's five major crashes are: 1992 (Harshad Mehta scam — Sensex fell 43%), 2001 (Ketan Parekh scam + dot-com bust — fell 38%), 2008 (Global Financial Crisis — fell 58%), 2020 (COVID-19 — fell 38%), and 2026 (US-Iran war + HDFC Bank shock — ongoing, Sensex down 15%+ YTD).
What should I do when the stock market crashes? Don't panic sell. Continue your SIPs (they buy more units at lower prices). Look for quality stocks at discounted valuations. Diversify your portfolio. Avoid leverage. Review your portfolio fundamentals rather than reacting to daily price movements.
How long does it take for the stock market to recover after a crash? Recovery time varies: the COVID crash of 2020 recovered in just 8 months, the 2008 GFC took about 32 months, and the 1992 Harshad Mehta scam recovery took about 7 years. The trend shows that recovery times have shortened in recent decades due to better regulations, more liquidity, and faster information flow.
What is the difference between a market crash and a correction? A correction is a decline of 10–20% from a recent high, usually gradual and considered a normal part of market cycles. A crash is a decline of 20%+ that happens suddenly over days or weeks, driven by panic selling. Corrections are healthy; crashes are driven by fear.
Is it good to invest during a stock market crash? Historically, yes. Investing during crashes has produced some of the best long-term returns. The Sensex was at ~26,000 during the COVID crash bottom in March 2020 and crossed 60,000 within 18 months. However, invest gradually (through SIPs or staggered buying), not all at once — because you can't predict the exact bottom.
Why is the stock market down today? The stock market is down today because of a combination of global and domestic factors: the ongoing US-Iran military conflict pushing oil prices above $112/barrel, continued FII selling (over ₹88,180 crore in March 2026), the Indian rupee at record lows, and the US Federal Reserve keeping interest rates unchanged at 3.75%. When these factors combine, the market falls sharply as both foreign and domestic investors reduce their equity exposure.
Conclusion
Whether you call it a stock market crash, a share market fall, or just “the market is down” — it's terrifying when you're living through one. The headlines scream doom, your portfolio is red, and everyone on social media is predicting the end of the financial world.
But history tells a different story. The Sensex has survived the Harshad Mehta scam, the dot-com bust, the Global Financial Crisis, a global pandemic, and now a Middle Eastern war compounded by a corporate governance shock at India’s largest private bank. Every time, it fell hard. Every time, it recovered and made new highs.
The informed investor doesn't celebrate crashes — but they don't fear them either. They continue their SIPs, look for quality at discounted prices, and most importantly, they don't panic sell.
If the March 2026 crash has you worried, look at the data in this article. With the Sensex down 15%+ YTD, the rupee at 93.71, and crude at $112–$115 — the fundamentals of India’s economy remain sound. Take a deep breath, check your portfolio fundamentals, and make a plan — not a panic decision.
Track 52-week lows and discover undervalued stocks on Rupeezy. Start or continue your SIPs — especially during crashes — to build long-term wealth.
Disclaimer: Investments in securities market are subject to market risks. Read all the related documents carefully before investing. The information provided here is for educational purposes only and should not be construed as investment advice. Past performance does not guarantee future results.
The content on this blog is for educational purposes only and should not be considered investment advice. While we strive for accuracy, some information may contain errors or delays in updates.
Mentions of stocks or investment products are solely for informational purposes and do not constitute recommendations. Investors should conduct their own research before making any decisions.
Investing in financial markets are subject to market risks, and past performance does not guarantee future results. It is advisable to consult a qualified financial professional, review official documents, and verify information independently before making investment decisions.

Open Rupeezy account now. It is free and 100% secure.
Start Stock Investment


All Category