Money Flow Index (MFI) in the Stock Market: How to Apply It
00:00 / 00:00
When you look at a stock chart, price is the first thing you notice. But price alone does not tell the full story. A stock can move up or down, and this is true. But the bigger question here is, how do you know when you should buy or sell the stock in the market as per the movements?
This is where the Money Flow Index becomes useful.
The money flow index is often called the MFI indicator. It focuses on not just the price but also the volume, which is quite important. It also becomes especially helpful when you compare stocks within the same sector to understand where stronger money flow is happening. But how does the money flow index indicator work, actually? Well, if you want to find the answer, read this guide. Explore what the money flow index is and how it works here.

What Is the Money Flow Index?
The Money Flow Index is a momentum oscillator. It measures the flow of money into and out of a stock. This is done using both price and volume data. It is often called a volume-weighted momentum indicator. This is because it captures not just price movement but the strength behind that movement.
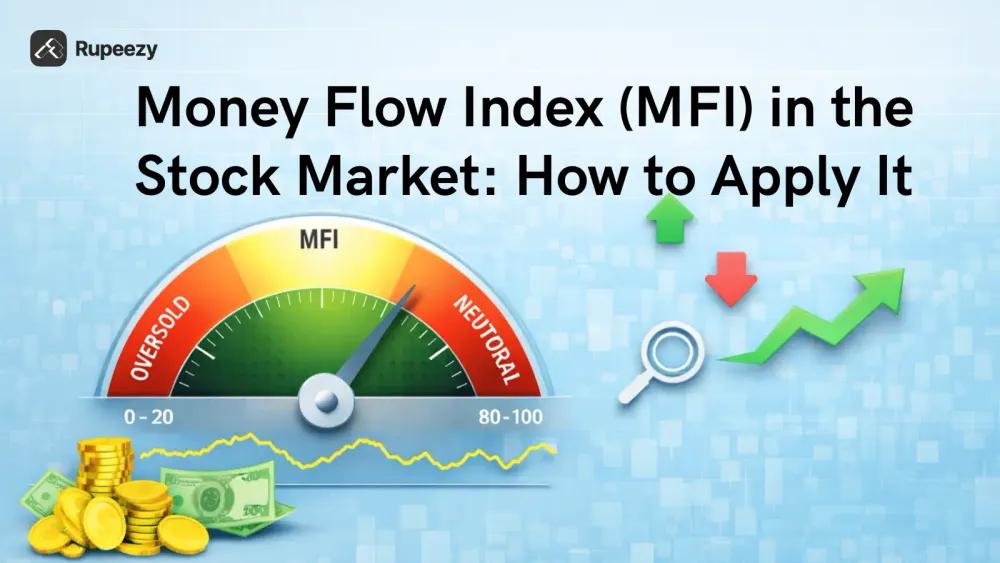
The MFI moves between 0 and 100. Higher readings indicate strong buying pressure, while lower readings reflect selling pressure. Traders commonly use a 14-period setting. This helps them to identify overbought and oversold conditions. Also, it supports detecting potential reversals.
Key Features of the MFI
Uses both price and volume for calculation.
Moves within a fixed range of 0 to 100.
The default setting is 14 periods.
Identifies overbought levels above 80.
Identifies oversold levels below 20.
Helps detect bullish and bearish divergence.
Simple to add to most trading platforms.
Pros of the MFI
Provides stronger confirmation as compared to just the price.
Helps spot potential reversal zones early.
Allows you to have a clear interpretation of the threshold levels.
Effective in range-bound market conditions.
Supports short-term trading decisions.
Cons of the MFI
False signals can be there, which makes trades incorrect.
Overbought or oversold levels may persist for long periods.
Not reliable when used alone without confirmation.
Low-volume stocks are not good for this.
Sensitive to sudden volume spikes.
Money Flow Index Formula
The first and most important step in calculating the MFI is finding the Typical Price. This forms the base of the entire calculation. So, here are the steps that will show you how to calculate the money flow index.
Step 1: Typical Price
Typical Price = (Low + High + Close) ÷ 3
This means you add the day’s low, high, and closing price. This is then totalled and divided by 3. It gives you an average price for that trading session.
Step 2: Raw Money Flow
Raw Money Flow = Typical Price × Volume
Once you have the Typical Price, multiply it by the trading volume of that day.
Step 3: Money Flow Ratio
Separate positive and negative money flows over 14 periods.
Money Flow Ratio = Sum of Positive Money Flow ÷ Sum of Negative Money Flow
Step 4: Final MFI Formula
MFI = 100 ? [100 ÷ (1 + Money Flow Ratio)]
This final value gives you the Money Flow Index reading between 0 and 100.
Key Components of Money Flow Index Strategy
The Money Flow Index becomes more reliable when applied through structured setups. These are not to be used as isolated readings. So, here are the common ways to use:
1. Overbought and Oversold Reversals
An MFI reading above 80 suggests strong buying pressure. This is potentially an overbought market. But if the reading is below 20, then it signals intense selling pressure. There may be oversold conditions.
So, you do not need to act immediately here. You must wait for MFI to move back inside the range. This shift confirms that momentum is cooling. It also improves reversal probability near support or resistance.
2. Divergence Strategy
It is one of the highest accuracy signals in MFI analysis. Now, if you find the bullish divergence, the price forms a lower low. But here the MFI forms a higher low. This is a sign of weakening selling pressure.
Again, in the bearish divergence, price makes a higher high. On the other hand, MFI makes a lower high. This is showing fading buying strength. Entry is taken only after the price confirms the shift.
3. Trend Continuation Through Retracements
In an uptrend, when MFI dips and then turns upward, it reflects renewed buying interest. In a downtrend, when MFI rises and then turns downward, it confirms fresh selling pressure. This helps traders enter during pullbacks instead of chasing extremes.
4. Combining with Other Indicators
MFI is often paired with RSI, MACD, or key indicators. This is to identify the support and resistance levels. Multiple confirmations reduce false signals. This also helps to improve the accuracy of the overall trades and better returns.

How to Use the Money Flow Index for Better Accuracy
Using the MFI is based on a proper set of steps. These include certain precautions like:
Avoid taking buy signals in strong downtrends or sell signals in strong uptrends.
Combine MFI signals with other key support and resistance levels.
Wait for price confirmation before entering.
Use divergence only when there is a shift in momentum.
Avoid relying on MFI in low-volume stocks.
Place a stop loss near the recent swing to manage risk effectively.
Conclusion
The Money Flow Index helps traders understand real buying and selling pressure. This is done by combining price and volume. But you must use this with trend analysis and other key levels. To apply indicators like MFI with structured insights and smarter decision-making, Rupeezy offers the right tools and market guidance.
FAQs
What is the Money Flow Index used for?
The Money Flow Index measures buying and selling pressure using both price and volume. Traders use it to identify overbought and oversold levels. It helps assess momentum strength.
What does an MFI above 80 mean?
An MFI reading above 80 indicates overbought conditions. It suggests strong buying pressure. This is a possible short-term pullback.
What does an MFI below 20 indicate?
An MFI reading below 20 signals oversold conditions. It shows strong selling pressure. It is possible bounce back near support levels.
Is the Money Flow Index better than RSI?
MFI includes volume in its calculation, while RSI focuses only on price. Because of this, MFI can provide stronger confirmation in volume-driven markets. Both indicators help with price analysis.
Can beginners use the Money Flow Index?
Yes, beginners can use MFI. It is simple to read with a 0 to 100 scale. However, it should always be used with other indicators.
The content on this blog is for educational purposes only and should not be considered investment advice. While we strive for accuracy, some information may contain errors or delays in updates.
Mentions of stocks or investment products are solely for informational purposes and do not constitute recommendations. Investors should conduct their own research before making any decisions.
Investing in financial markets are subject to market risks, and past performance does not guarantee future results. It is advisable to consult a qualified financial professional, review official documents, and verify information independently before making investment decisions.


All Category