Mastering the Relative Strength Index (RSI): Formula, How To Trade, Strategies


00:00 / 00:00
What Is Relative Strength Index (RSI)?
The Relative Strength Index (RSI) is a momentum oscillator that measures the speed and change of price movements of a security.
Developed by J. Welles Wilder he introduced RSI in his 1978 book, New Concepts in Technical Trading Systems. RSI oscillates between 0 and 100.
In this article we will learn how to do trading with the help of Relative Strength Index (RSI) Indicator .
Relative Strength Index Indicator Explained

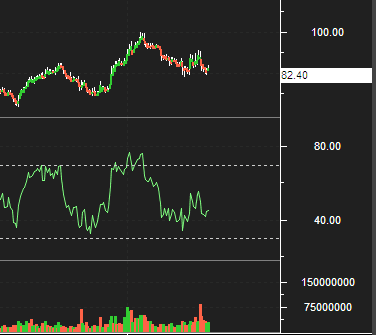
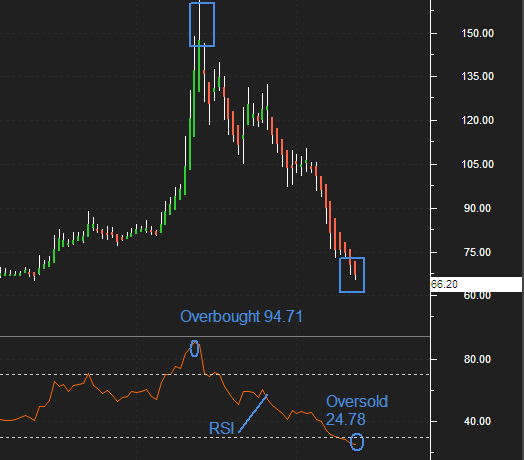
First thing to remember while using RSI is , when the indicator is above 70 for a particular stock it is considered overbought whereas when the indicator is below 30 it is in oversold zone .
Another key point as you can easily see in charts above ,the moment stock has hit the overbought trajectory i.e above 80 , it created a signal .
Similarly when stock moved down below 30 you can see RSI is oscillating in oversold condition . This helps in knowing the general trend of a stock .
Relative Strength Index (RSI) indicator formula
Formula used to calculate RSI :
RSI = 100 – [100 / ( 1 + (Average Gain / Average Loss ) ) ]
Over here Average Gain means Average of Upward Price Change & Average Loss is Average of Downward Price Change .
Furthermore in this formula average losses considered as positive value .The default setting used for the RSI is 14 days period for daily charts .
Also Known as ‘look-back period’. In case you are analyzing hourly chart default period is 14 hours .
Let us Understand this through an Example : Suppose the stock is trading at 49 on day 0, with this in mind we will attempt basic RSI calculation.
| Sl No | Closing Price of stock | Points Gain respect to the previous day close | Points Lost respect to the previous day close |
|---|---|---|---|
| 01 | 50 | 1 | 0 |
| 02 | 53 | 2 | 0 |
| 03 | 57 | 4 | 0 |
| 04 | 54 | 0 | 3 |
| 05 | 51 | 0 | 3 |
| 06 | 56 | 5 | 0 |
| 07 | 58 | 2 | 0 |
| 08 | 60 | 2 | 0 |
| 09 | 59 | 0 | 1 |
| 10 | 62 | 3 | 0 |
| 11 | 64 | 2 | 0 |
| 12 | 61 | 0 | 3 |
| 13 | 59 | 0 | 2 |
| 14 | 65 | 6 | 0 |
| Total | 27 | 12 | |
From the table above Average Gain – 27/14 =1.928 (where 14 is the default period) , Average Loss – 12/14 = 0.857
as per formula the calculation will be : RSI = 100 – [100 / ( 1 +(1.928/0.857) ) ] ,
= 100 – [100 / ( 1 + 2.250) ]
= 100 – 30.76
RSI = 69.23
Keep this in mind that you do not need to calculate it by yourselves . It will be available as a technical indicator inside your trading tool .
Another key point is you may decide to use 5,10,20, or even 100 days look back period if you want too. Using 14 days is not compulsory . Try making your own strategies , as it help in giving you a edge over others .
Relative Strength Index (RSI) indicator For buy and sell signals
RSI indicator is much more than buy or sell signal. It can help you in knowing the trend whether , upwards downwards or sideways . As we have discussed earlier , just to remind you again consider these points :
- When the RSI is between 30 and 0, the security is supposed to be oversold and usually follows an upward correction.
- When the security reading is between 70 and 100, the security is supposed to be over bought and is prepared for a downward correction .

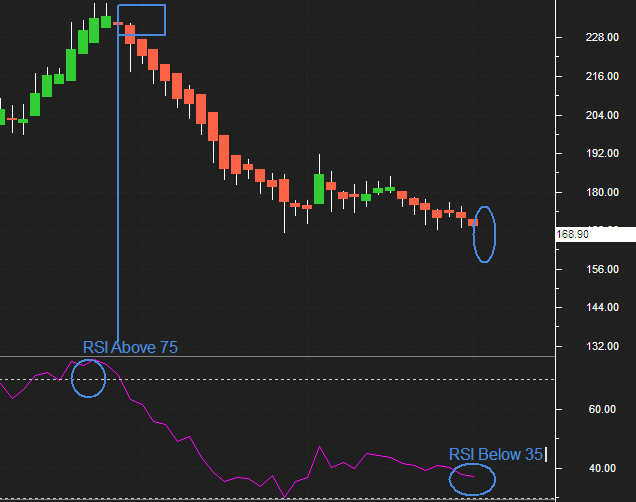
In the daily chart Above of TATA MOTOR’S , we have used default 14 days period . Pink line representing the RSI signal , its above 75 and can be seen in overbought zone .
Like wise when RSI Signal showing below 35 its now in oversold zone . Being a trader or investor you can benefit from this signals .
Either by going long when its in oversold zone & short when its in overbought zone .
Important points before we take any trade using RSI Indicator
- In case of an uptrend or market being bullish ,the RSI tends to remain in the 40 to 90 zone with the 40-50 zone acting as support.
- Whereas during a downtrend or market being bearish the RSI tends to stay between the 10 to 60 range with the 50-60 zone acting as resistance.
- A stock can be in uptrend for few days to few years therefore, RSI will remain stuck in the overbought zone for a long time, this happens because RSI cannot go beyond 100.
Being a trader you would be looking at shorting opportunities but the stock on the other hand will be in a different region.
For Instance, MRF’s shares grew sharply by 2,210 per cent between May 11, 2009 to May 9, 2019. The stock growth consolidated to 154.83 per cent in the last five years.
- Similarly a stock with bearish nature constantly in downtrend stuck in the oversold region for long ,the RSI would be going below 30 to 0.
It cannot go beyond 0. In this case as well the trader will look for buying opportunities however the stock will be going down lower.
For example, Gitanjali Gems topped the list last year (2018) by destroying 98.55 per cent of investor wealth in a year.
Conclusion
The Relative Strength Index (RSI) is most trustworthy indicator in market . Whenever the price is oscillating between bullish and bearish periods.
However ,do note use RSI alone as an indicator, it should be used along with other candlestick patterns and indicators to study the market.
If you are new to trading, combining the RSI with another indicator like volume or moving averages will keep you ahead of other traders . Few brief point important are listed below :
- In case if RSI is stuck in an overbought region for a long period, check for buying opportunities instead of short.
- If RSI is firmed in an oversold region for long time, look for shorting opportunities rather than buy.
- In case if RSI reading starts moving from the oversold zone (Going above 30) after a long period, look for buying opportunities.
- In case if RSI reading starts moving from the overbought region (Falling below 70) after a long time, look for shorting opportunities.
I will end this blog by a Quote from famous trader & Investor Peter Lynch . I Hope you have like this blog.
Try to clear your doubts & keep learning as much as you can . Write in comment box if you have any doubt or feedback.
The content on this blog is for educational purposes only and should not be considered investment advice. While we strive for accuracy, some information may contain errors or delays in updates.
Mentions of stocks or investment products are solely for informational purposes and do not constitute recommendations. Investors should conduct their own research before making any decisions.
Investing in financial markets are subject to market risks, and past performance does not guarantee future results. It is advisable to consult a qualified financial professional, review official documents, and verify information independently before making investment decisions.
Open Rupeezy account now. It is free and 100% secure.
Start Stock InvestmentAll Category


