Volume in Stock Market: Different Types and How to Use Them


00:00 / 00:00
Volume is one of the most powerful indicator, which is often overlooked by many traders and investors while placing trade in share market. Volume helps you in knowing about the current perception of all the market participants for a given security.
It is easily available on your trading platform, which you use to place trade. Till now you might have not paid lot of attention to it, but after reading this blog you will gain a new insight. So without further delay let us understand the basics of volumes and its implication in stock market.
What is Volume?
Volume is a tool to know how many shares have been bought and sold in a given period of time. It helps in analysing the trends and patterns.
Whether you are talking about shares of an individual stock or the number of options contracts traded, or an entire stock market, volume information can be found just about anywhere.
The point is very few traders or investors know how to use this information to increase their profits and minimize risk. Volume provides an indication of investors interest in a stock.
For all buyers in the market, there needs to be someone who sells them the shares they bought in order to have a trade. As an illustration suppose if you buy 1000 shares of State Bank of India (SBI) at 270, and your friend sell 1000 shares of State Bank of India (SBI) at 270.
You and your friend together have created a volume of 1000 shares in total. Many traders makes an assumption that volumes count for above will be 2000 (1000 buy+1000 sell), which is incorrect.
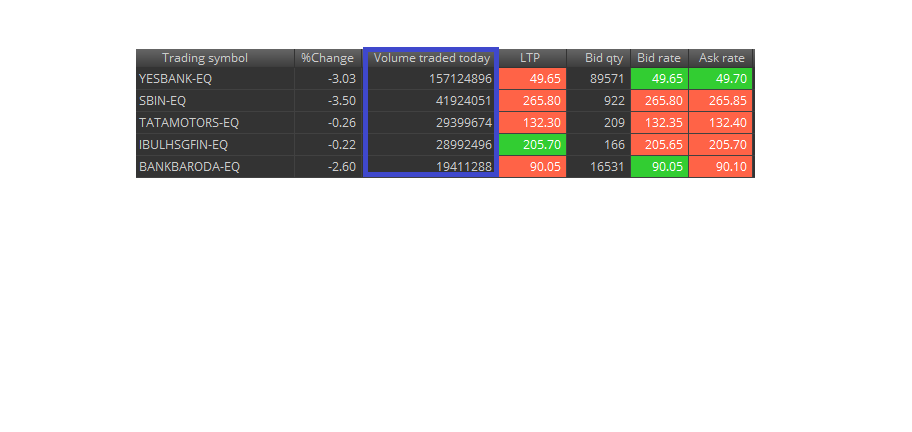
Check this data showing volume of different Stocks

As you can see in above image, blue box represent the volume of shares traded during live market of few stocks listed on NSE. All the volumes are in cumulative(increasing).
Below is the example showing volume on a usual trading day, please make a note how this adds up at the end of the trading session. It’s important to note that when counting volume, each buy/sell transaction is counted only once.

This war between buyers and sellers for the best price in all different time frames creates short-term price movement.
However the point is now you know what volume is, but how this going to help you at all. Simply seeing volume does not give any idea as to what exactly is happening in a particular stock.
When analyzing volume, there are guidelines we can use to determine the strength or weakness of a move. Volume can be very useful in identifying bullish and bearish signs in a stock.
How To Use Volume Data In Trading and Investing?
You have observed this couple of times while trading, when any stock-specific news items are released like good quarterly earning or new production site setup for any company, market react towards such news with buying resulting in high volumes.
Similarily any negative news have a bad impact which causes negative reaction and spike in volumes. Before we understand the use of volumes data in trading one should be aware of types of market participants.
What kind of investors and traders are there in the market ? Let us discuss this one by one. So first of all Anyone who do any transactions in stock market is referred to as ‘Market Participant’ .
These market participants can be classified in to various categories
Domestic Retail Participant – These are individuals like you & me. So any single, independent doing investment, trading or transaction in the market.
NRI and OCI – People who are based out of india but born in india. Indian origin based out of india.
Domestic Institutions (DII’s) – Huge corporate organisation based in india. Most of them are big insurance companies, mutual fund companies.
Domestic Asset Management Companies (AMC) – An asset management company (AMC) is a firm that invests pooled funds from clients, They put there money to work in different investments including stocks, bonds, etc. Some Typical examples ICICI Prudential Mutual Fund. HDFC AMC, SBI MUTUAL FUND etc.
Foreign Institutional Investors (FII’s) – These are non- Indian corporate organisations or entities, Foreign Asset management companies, hedge funds etc.
The reason to know these information has direct link with volumes. Retail traders have a very small role in creating high volume, the primary reason are big players in market. When institutional investors buy or sell they do not transact in small amount of shares.
Suppose if Domestic Asset Management Companies like HDFC AMC buying shares of any stock, it will be huge no. may be in lakhs and crores, this will have a significant impact in price of the stock as well as the volume.
One more thing to notice is if any of such big players are interested in buying any specifc stock, than certainly that company is doing much better than its peers.
Below is the table which will help you in knowing the impact of volume in price and expectation moving forward.

Volumes should be looked at relative to recent history. It is best to compare today’s volume to average volume of last 10, 20 or 50 days for seeing irrelevant data.
The more recent the data sets, the more relevant they are likely to be. When we say increase in volume this actually mean today’s volume is higher than the average of the last 10,20,50 days volumes.
Understand this once again if there’s a higher volume of trading in a particular stock, that usually means that investors are interested in buying or selling it.
If volume and price are on the rise, it means investors are betting the company will do well. Whereas if volume is up but price is down, it means more investors are looking to sell.
Also remember higher volume for a specific security results in higher liquidity. Knowing what other investors are trading is important for understanding what stocks are in play and which are likely to make big moves.
Let us understand the content of above table:
If both Volume and Price Increases, this will results in bullish view on stock in further trading session.
If volumes are decreasing but stock price is increasing than there are more retail participation rather than institutional investors. One need to avoid such situation as it might be a bull trap.
Whereas if volumes are increasing but price of stock is decreasing than big investors are selling, hence view on stock should be bearish.
In case both volume and price are decreasing than it means the price is decreasing because of small retail participation, and not because of institutional investors are selling. Volume is also decreasing as retailers are selling rather than big investors. This situation can lead to bear trap, one need to avoid placing trade in such scenario.
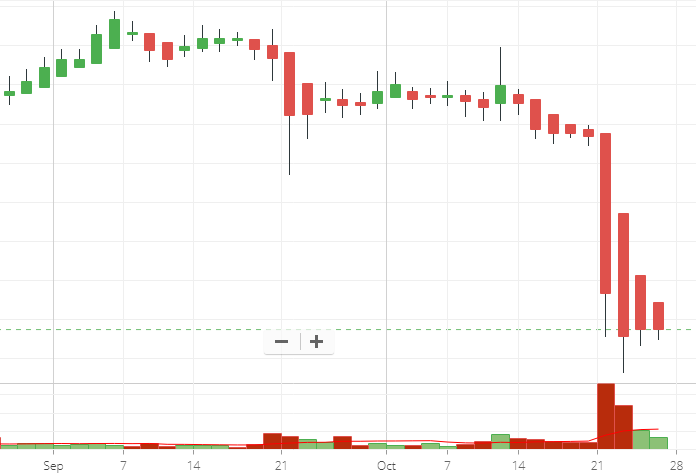
Please take a look on the given chart below of INFOSYS LTD. This happened due to the recent rumor (news) of a whistle blowers who alleged that Parekh and Roy were using aggressive accounting strategies and potentially hiding information from auditors to boost revenue and profit margins.
This lead to spike in volume with decrease in price.

You can easily draw a moving average on the volumes bar to know if today’s volume is higher than the previous days volume average of 10,20 or 50 days. To get the last 10,20,50 day average, all you need to do is draw a moving average line on the volume bars on your trading terminal.
What Are Different Types Of Volumes?
There are two types of volume:
Delivery volume – delivery volume is the shares which get transfers from one Demat account to the other and they are not squared off within a day
Traded Volume – Traded volume is the total number of shares traded in a day.
In the above image, red box shows total volumes generated within a day (including intraday and delivery). Whereas, deliverable quantity reflects no. of shares went to demat account. If you deduct the total volumes with deliverable volumes you will get intraday volumes.
Volume also reflects the supply and demand in market or for a stock. A stock with low volume is said to be illiquid. When volume is low, the spread between what buyers are willing to pay and what sellers are asking to take (bid-ask price) will increase, making successful trades more difficult to make.
As a result, selling an illiquid stock quickly can be difficult or impossible without accepting the lower bid price. Also, because the spread is wide, illiquid stocks are given to large price fluctuations in either direction when they do trade. So please avoid stocks with low liquidity with low volumes in share market.
What is Delivery volume?
Deliverable quantity or Deliverable Volume is the quantity of shares which actually move from one set of people ,who had those shares in their demat account before today and are selling today to another set of people, who have purchased those shares and will get those shares by T+2 days in their demat account.
As an Illustration, Suppose Person A sells 1000 shares
Person B buys those 1000 shares and sells it to Person C
Now, Person C buys those 1000 shares and sells it to D.
Person D after buying those shares is keeping it with him as delivery
Here Total Volume is 3000 shares (1000 shares delivered from A to D ideally, 2000 shares done in Intraday)
Deliverable quantity is only 1000 shares.
It is not necessarily that every trade settles. Some trades are of intraday in nature, in which the trade positions are closed within the day. Delivery volume can be derived by deducting the intraday volume with total volume.
When the number of shares are taken for delivery it means that more shares are being accumulated. It shows the investors are getting more interested in this stock because of prospects.
The way you analyze deliverable volumes is, if the stock is going up or down with high deliverable volumes, the move is supposed to be stronger as long term investors are getting in or out respectively.
Volume Best Example
Suppose, A buys 1000 shares, B sells 1000 shares
Volume = 1000
Now after sometime, A sells 700 shares, B buys 700 shares
Volume = 700
So Delivery volumes is 1000-700 = 300 and Total traded volumes in day 1000+700 = 1700
Volumes may not be an attractive piece of information but you should try to combine the volume data with resistance and support levels to get a clear picture.
We won’t be studying these indicators in this blog, however we will make a separate blog for most important of them but some other time.
Volumes indicators are mathematical formulas that are graphically represented in most charting platforms. Each indicator uses a slightly different formula, hence traders should find the indicator that works best for their particular strategy.
Indicators are not required, but they can add and make a impact in the trading decision process.
In general, assets with higher trading volume, whether they’re stocks or something else, are also considered more liquid.
If you want to sell a stock or anything else, then the higher the volume, the more people are actively trading it and the more likely you are to find a buyer at the price you want.
Volumes analysis isn’t perfect and it offers only supplemental information, so you don’t need to feel pressured to start analyzing volume to day trade successfully.
If you have any questions or feedback please let us know in comment box below.
The content on this blog is for educational purposes only and should not be considered investment advice. While we strive for accuracy, some information may contain errors or delays in updates.
Mentions of stocks or investment products are solely for informational purposes and do not constitute recommendations. Investors should conduct their own research before making any decisions.
Investing in financial markets are subject to market risks, and past performance does not guarantee future results. It is advisable to consult a qualified financial professional, review official documents, and verify information independently before making investment decisions.
Open Rupeezy account now. It is free and 100% secure.
Start Stock InvestmentAll Category


