Treynor Ratio in a Mutual Fund

00:00 / 00:00
Most of the investors who invest in a mutual fund often focus on receiving high returns while undermining the level of risk associated with their investments. To know whether the returns they are receiving are actually worth the risk they have undertaken, we will look at one of the Risk Ratios, like the Treynor Ratio, that can help you to measure the risk-adjusted performance and help investors to make better investment decisions.
In this article, we will learn about the Treynor Ratio in mutual funds, why it matters, and how it is used. Understanding the Treynor ratio will help investors make better investment decisions.

What is Treynor Ratio in Mutual Fund?
The Treynor ratio in mutual funds, also known as the reward-to-volatility ratio, is a financial performance metric that helps investors determine how much extra return they are receiving for each unit of risk taken on by an investment portfolio. It focuses only on systematic risk (risk that cannot be controlled), which is measured by beta.
How to Calculate Treynor Ratio
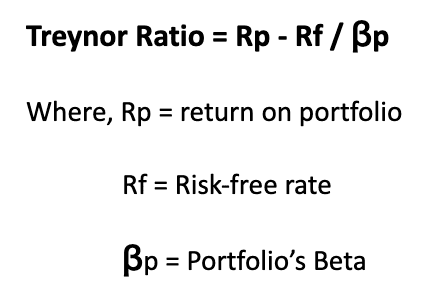
As we have understood the Treynor meaning, let us now understand how the Treynor ratio is calculated. The Treynor ratio formula below shows how to calculate:
Treynor ratio example
Now that we have looked at the formula, let’s crunch it with some numbers to understand better with an example:
Assume a portfolio of an investment firm has an average return of 15% over 6 years, a risk-free rate (Government Bond) of 6%, and a portfolio beta of 1.30.
So, Rp = 15%
Rf = 6%
?p = 1.30
Applying the formula = Rp - Rf / ?p
So, the Treynor ratio of the fund will be
= 15% - 6% / 1.30
= 0.0692 or 6.92%
The portfolio is generating an additional 0.0692 or 6.92% relative to its risk, which indicates that the returns generated from the portfolio have considered systematic risk. The above example shows that the returns of the portfolio are 15%, while the Treynor ratio shows that the risk-adjusted returns of 6.92%.
Why does the Treynor Ratio matter to investors?
The Treynor Ratio is important in investment decisions; consider the following points to understand why:
It helps in calculating the returns that investors receive for the amount of risk they take when compared to a safe investment, such as a government bond, allowing investors to determine whether the risk they take is truly paying off.
This ratio is used by portfolio managers to compare the performance of different funds. So, investors can determine which portfolio provides the higher returns.
It is useful to know how well a diversified portfolio performs when only market risk is taken into account (which cannot be controlled, such as inflation), because other types of risk, such as unsystematic risk (business risk), can be eliminated or mitigated through diversification.
The Treynor ratio also manages risk by displaying the amount of return investors receive for each unit of market risk. This allows us to determine whether the risk we are taking is yielding appropriate returns.

When to use the Treynor Ratio instead of other ratios like the Sharpe or Sortino
Treynor, Sortino, and Sharpe ratios are commonly used to evaluate risk-adjusted performance. However, the Treynor ratio is used only for a specific situation, particularly when you are measuring whether your investment returns are sufficient for the systematic risk. Here are some points that state when to use the Treynor ratio instead of other ratios:
While analysing different mutual funds, let’s say you compare them with beta. But it interprets only the volatility, not about returns. That’s where Treynor comes into the picture. Along with beta, you can use the Treynor ratio to shortlist the mutual funds that meet our goals and align with your risk appetite.
Let's say you're analysing an actively managed large-cap fund, and you notice that it has a positive alpha, which suggests it has outperformed its benchmark. However, the alpha ratio doesn’t tell you how much market risk the fund took to achieve that excess return. To get clarity, the Treynor Ratio helps us to measure the return per unit of market risk, thus giving a clearer picture.
While comparing two diversified mutual funds. For example, Fund A has a lower standard deviation, and Fund B has a higher R-squared, which means it closely follows the benchmark. At first glance, these data might make Fund B look more consistent and Fund A less risky. But these metrics ignore how well the fund compensated for the market risk it took. In this situation, using the Treynor Ratio can help compare how effectively each fund used its exposure to the market to generate returns.
How to use the Treynor ratio to choose the right fund
The Treynor ratio is used to compare various investment portfolios, and the fund with the highest Treynor ratio is generally considered to be the best. A high Treynor ratio indicates that the investment portfolio is performing well and producing good returns relative to the risk taken. Whereas a low Treynor ratio indicates the need to adjust the portfolio through diversification in order to reduce risk.
Let us see how an investor can use the Treynor ratio to select the best mutual fund using the following example:
M Mutual Fund | Portfolio’s Beta (?p) | Portfolio returns (Rp) |
Mutual Fund X | 1.06 | 10% |
Mutual Fund Y | 0.9 | 15% |
Mutual Fund Z | 2.5 | 19% |
Risk-free rate of the above 3 mutual funds | 6% | |
After calculating the Treynor ratio of the above three mutual funds
Treynor ratio of X = 10% - 6% / 1.06 = 0.09
Treynor ratio of Y = 15% - 6% / 0.9 = 0.15
Treynor ratio of Z = 19% - 6% / 2.5 = 0.07
Comparing the above 3 mutual funds, Mutual Fund Y offers the highest return for each unit of the risk taken and also has a low beta. Even though Fund Z has the highest overall return, it also has much risk, which can make it a high-risk proposition. It is more suitable for high-risk investors, who are young and eager to invest in riskier assets.
Alternatives to Treynor Ratio
There are other alternatives which are used by investors apart from the Treynor ratio before taking any investment decisions; they are:
Sharpe Ratio: The Sharpe Ratio is a financial metric that shows how much excess return you are receiving for each unit of total risk you assume. A higher Sharpe ratio, which is above 1, is considered good for investors, as it indicates higher returns for the amount of risk assumed.
Sortino Ratio: This risk-adjusted return measure evaluates the performance of an investment or portfolio by focusing on downside risk rather than overall volatility. A higher Sortino ratio indicates higher returns for each unit of downside risk.
Conclusion
To summarise, the Treynor Ratio is an important financial metric that helps investors understand whether the returns they are receiving are justified by the risk they have taken. However, before making any investment decisions, investors need to consider their limitations as well. Using other metrics or ratios in parallel to Treynor will provide more clarity on the decision-making ability. Always conduct extensive research before making any decisions, or consult a financial advisor before investing.
FAQs
Q1. Is a higher or lower treynor ratio better
A higher Treynor ratio is good for investors, as it gives more returns for each unit of market risk.
Q2. What does a Treynor ratio of 0.5 mean?
A Treynor Ratio of 0.5 means the portfolio is generating 0.5 units of excess return (above the risk-free rate) for every 1 unit of market risk taken, as measured by beta.
Q3. What is a good Treynor ratio for mutual funds?
There is no actual measure of the Treynor ratio, as it should be compared with other mutual funds. However, a Treynor ratio greater than 0.5 and closer to 1.0 is considered a good Treynor ratio for mutual funds or any other asset class.
Q4. Can SIP investors rely on Treynor Ratio for Fund Selection
Yes, they can consider Treynor Ratio for Fund Selection. However, the Treynor ratio should not be solely considered to make any investment decision, and it is better to use other metrics apart to make informed choices.
Check Out These Related Articles |
The content on this blog is for educational purposes only and should not be considered investment advice. While we strive for accuracy, some information may contain errors or delays in updates.
Mentions of stocks or investment products are solely for informational purposes and do not constitute recommendations. Investors should conduct their own research before making any decisions.
Investing in financial markets are subject to market risks, and past performance does not guarantee future results. It is advisable to consult a qualified financial professional, review official documents, and verify information independently before making investment decisions.


All Category