Doji Candlestick Pattern – Meaning, Types & What It Indicates

00:00 / 00:00
In the world of technical analysis, understanding candlestick patterns is essential for predicting market movements and trends. One of the most widely recognized and significant patterns is the Doji candlestick pattern. A Doji represents indecision in the market, where the opening and closing prices are almost identical. In this article, we’ll explore the Doji candlestick pattern, its meaning, types, how it’s used by traders, and real-life examples to help you improve your trading strategy.
Doji Candlestick Pattern Meaning
The Doji candlestick pattern occurs when the opening price of an asset is nearly equal to its closing price, indicating that the market is in a state of indecision. This pattern generally has small real bodies and long upper and lower shadows, reflecting the struggle between buyers and sellers.
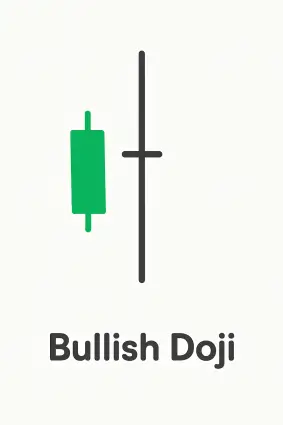
Bullish Doji: When the Doji forms during a downtrend, it can signal a potential reversal to an uptrend. This means the bears (sellers) may be losing their grip, and the bulls (buyers) could start taking control of the market.
Bearish Doji: When it forms during an uptrend, it can suggest a possible reversal to a downtrend. This shows that the bulls may be losing their strength and the bears could gain control.

Types of Doji
There are several types of Doji candlestick patterns, each with subtle differences and varying implications for traders. Below are the main types:
Neutral Doji: The simplest form, representing indecision, where the market opens and closes at nearly the same price level.
Standard Doji: The basic Doji pattern that typically appears when there is a stalemate between buyers and sellers.
Long-Legged Doji: This Doji has longer shadows, indicating greater indecision in the market, where the price movement is uncertain, and could signal a reversal.
Gravestone Doji: With a long upper shadow and a small body near the lower end, this pattern signals potential market top reversal after an uptrend.
Dragonfly Doji: The opposite of the Gravestone, with a long lower shadow and a small body near the upper end, suggesting a reversal during a downtrend.
Use of Doji
In the Indian stock market, the Doji pattern is widely used to identify potential reversal points or areas of market consolidation. Here's how traders typically use the Doji pattern:
Reversal Indicator: A Doji that appears after a strong trend (either up or down) can be an early signal of a trend reversal. For example, in the Indian stock market, if a stock has been rising for a while and forms a Doji, it may indicate that the trend is losing momentum and a downtrend might be imminent.
Indecision or Consolidation: The Doji pattern can also signal that the market is in a state of indecision, and prices may continue to move sideways before making a stronger move in one direction. Indian stocks, especially those with high volatility, may experience such consolidation periods.
Doji Candlestick Pattern Example
Let’s consider a bullish Doji pattern. Suppose you are observing the stock of Reliance Industries, which has been in a downward trend for a few days. Suddenly, the price forms a Doji candle. This could signal that the selling pressure is weakening, and the bulls may be gearing up for a reversal. The next day, the price might rise, confirming that the Doji pattern was an indicator of the trend reversal. This is how Indian traders use the Doji candlestick to anticipate market movements.
Conclusion
The Doji candlestick pattern is a crucial tool for traders in the Indian stock markets, as it provides insights into market sentiment and potential reversals. Understanding the different types of Doji patterns and how to interpret them can help traders make better decisions, whether they're investing in Nifty 50 stocks, mid-cap, or small-cap stocks. By incorporating Doji analysis into your trading strategy, you can identify critical turning points in the market and potentially improve your investment returns.
If you're using the Rupeezy trading platform, mastering the Doji pattern can significantly enhance your technical analysis and help you navigate market movements more effectively. If you haven't tried the Rupeezy platform yet, open your Demat account with Rupeezy today.

The content on this blog is for educational purposes only and should not be considered investment advice. While we strive for accuracy, some information may contain errors or delays in updates.
Mentions of stocks or investment products are solely for informational purposes and do not constitute recommendations. Investors should conduct their own research before making any decisions.
Investing in financial markets are subject to market risks, and past performance does not guarantee future results. It is advisable to consult a qualified financial professional, review official documents, and verify information independently before making investment decisions.

Open Rupeezy account now. It is free and 100% secure.
Start Stock Investment


All Category