Bollinger Bands: Learn How to Calculate, Process, and Strategize


00:00 / 00:00
Bollinger Bands are a technical analysis tool used to analyse volatility of a security. Bollinger bands helps in identifying the overbought and oversold levels.
John Bollinger introduced bollinger bands in 1980’s.
Bollinger Bands can be used on most financial instruments like equities, indices, foreign exchange, commodities, futures, options and bonds.
What is Bollinger Bands?
They are curves drawn in and around the price structure on chart.
It primarily consist of a simple moving average (also known as the middle band), an upper band, and a lower band.
This bands helps in knowing whether prices are high or low on a relative basis.
This curves when drawn on a chart helps in taking buy or sell signals. Whenever the price touches the upper band a sell can be triggered.
On the other hand when price touches lower band a fresh buying position can be started.
How are Bollinger bands calculated?
Bollinger bands are calculated by assembling this 3 elements given below :
- Middle line usually a 20 day simple moving average of the closing prices.
- Upper band – this is plotted +2 standard deviation above the middle line
- A lower band – this is plotted -2 standard deviation below the middle line
Standard deviation (SD) is same as volatility. Standard deviation is a mathematical measurement of average variance used in statistics, economics, accounting and finance.
A simple moving average is used because the standard deviation formula also uses a simple moving average.
Do not get worried as you will not be calculating this values by your own. On your trading software it is easily done just by few clicks.
How does the Bollinger band work?
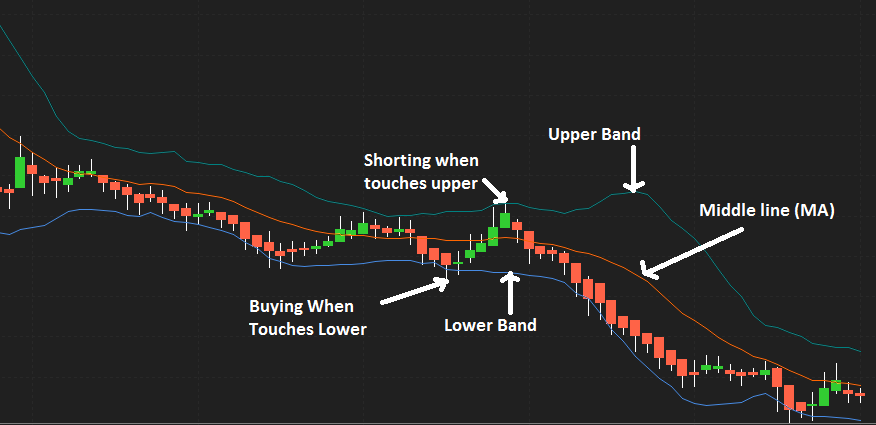
To know how bollinger bands works let us see a chart and do some analysis. Below is the recent Day Chart of TATA MOTORS LTD.

As you can see i have plotted the bollinger bands on chart .The middle orange line is the 20 day SMA.
The other two lines placed above and below the middle line are the +2 Standard Deviation & -2SD.
Whenever there is uptrend in a stock it tends to travel from lower band to upper band. I have highlighted using a arrow all the buy & sell signals BB generated.
The plan is to short the stock when the price touches the upper band. However it will first revert back to middle line which is also average.
This act as an strong support during downtrend. Similarly one can buy when the price touches the lower band. The middle line will act as an resistance in that case.
In chart above can you see the continuous downward rally? A chartist or analyst will use this in his favour by riding the rally.
The price is frequently touching the lower band while falling low from middle line. As there is no sign of stock showing reversal to middle line, you can short the stock till there is any new signal.
Also observe the candlesticks stop touching the lower band and resisted for some time. This shows the sideways trend for some time in stock.
So to say, if you see couple of candles touching upper or lower band than it can lead towards same direction.
However you can look for shorting opportunities at upper band and going long at lower band.
Bollinger Bands Trading Strategy Points To Remember
- Closer the prices move to the upper band, more overbought the market.
- closer the prices move to the lower band, more oversold the market.
- Buying when stock prices cross below the lower Bollinger Band.
- Selling when stock prices cross above the bollinger band.
- It is useful in trending as well as non-trending market.
- The upper and lower bands act as a trigger to open a trade.
- Breakout above or below the bands is a crucial event.
- The breakout is not a trading signal.
- However a new trend towards up or down indicating a strong momentum.
- Wider the bands greater is the volatility.
- Narrow bands reflects low volatility hence sideways movements.
- Bollinger Bands are not meant to be used as a stand-alone tool.
- Analyst should combine Bollinger Bands with basic trend analysis and other indicators for confirmation.
Conclusion
My humble advise to all traders out there to do not use this indicator alone.
You should always check in combination with other indicators, moreover keep eye on various candlestick patterns formation on chart as well.
Once you have the confirmation open the trade with stop-loss.
It might happen the trade still does not go in your favour, and this can happen with most experienced traders as well.
However with using all tools techniques your chances of succeeding in market will be much higher than other.
Also let us know what kind of strategy you follow in your trade in comments below.
The content on this blog is for educational purposes only and should not be considered investment advice. While we strive for accuracy, some information may contain errors or delays in updates.
Mentions of stocks or investment products are solely for informational purposes and do not constitute recommendations. Investors should conduct their own research before making any decisions.
Investing in financial markets are subject to market risks, and past performance does not guarantee future results. It is advisable to consult a qualified financial professional, review official documents, and verify information independently before making investment decisions.
Open Rupeezy account now. It is free and 100% secure.
Start Stock InvestmentAll Category


