Achieving Optimal Results with Rice Product Feature Prioritization

00:00 / 00:00
In the bustling and fiercely competitive landscape of the modern business world, achieving product-market fit can be a make-or-break factor for any company.
With countless companies vying for customer attention, the path to success often involves navigating a maze of challenges and iterations.
The journey to product-market fit can be arduous and time-consuming, but a few exceptional companies stand out, consistently reaching the best fit effectively and rapidly.
Rupeezy has developed numerous new stock trading and trade analysis platforms with hundreds of features like options strategy builder, options chain, options greeks etc.
with limited iterations in the last two years. After the development sprints, the application ratings have improved from 2.7 to 4.3.
The company has a healthy growth rate with healthy profitability, in a highly competitive stock broking and wealth management space.
How are the product managers at Rupeezy able to achieve this? The answer lies in minimizing the back and forth by strong decision making frameworks.
One such framework that has helped in solving feature prioritization was developed by the team in-house. Let us delve a little deeper before we discuss the methodology.
In Product Management, one of the most crucial decisions for product managers is to determine which products, features or projects they need to prioritize.
Before embarking on a development roadmap, this stage is most important to utilize limited resources and deliver maximum intended impact for business.
There are different methods product managers employ as a feature prioritization tool to identify features most valuable for customers and business, as well as their financial and technical feasibility.
Four Parameters On The Rice Scoring Model
The Rice scoring model is one such method that evaluates and scores every feature on four parameters:
- Reach: How widely is the specific parameter used in terms of no of users
- Impact: What is the net impact of the parameter in overall product
- Confidence: How confident is the business or product manager about the parameter
- Effort: How much effort will go in building and implementing the parameter in terms of man hours, money and opportunity cost.
The RICE model, despite its global popularity, posed challenges for the Rupeezy team in accurately quantifying impact and confidence scores, resulting in certain overlapping assessments.
In response, the team adopted a proactive stance and devised a unique feature prioritization model, building upon the principles of the RICE scoring methodology.
A meticulous SWOT analysis of diverse feature prioritization tools culminated in the creation of the RFID model, proving remarkably effective in delivering a diverse range of new tools and features tailored to their fintech clientele in India.
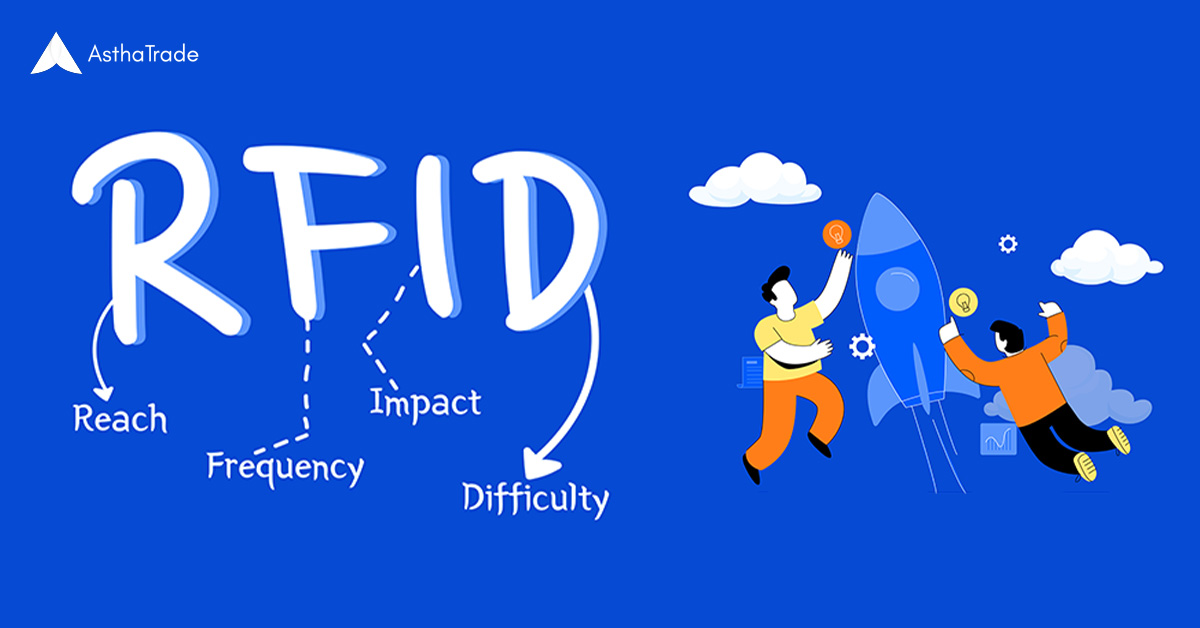
RICE scoring model customised to suit the specific use case resulted in R (Reach), F (Frequency), I (Importance), D (Difficulty).
Reach
Reach was studied by running a pilot on the number of users that are going to use the particular feature.
For example, a trading website may add a stock’s fundamental analysis on its website for users to study before investing, but not all users would want to use this feature.
Users may have done their research beforehand and skip the stock’s fundamental analysis section.
The Reach is then the percentage of users expected to check stock’s fundamental analysis and this score is normalized on a scale of 10.
E.g. if all users are expected to use the feature, the Reach score would be 10.
Frequency
Frequency is the number of times the feature is expected to be used by one particular user in a day, week or month.
There are features with high frequency of usage e.g. adding stocks to watchlist. Then, there could be features with very low usage frequency, e.g. ‘Help’ menu.
The expected frequency of usage of all the features is again normalized on a scale of 1 to 10.
E.g. if a feature is expected to be used more than 3-4 times in a day, its frequency score would be 10 and another feature which is expected to be used 1-2 times in a year will have frequency score 1.
Now the product team must assess the reach & frequency vis-à-vis its Importance.
Importance
This is the most tricky score, where the skills of the product manager are tested the most.
The importance of a feature is determined by asking the question – How severe a discomfort will it be for the user if the feature is made unavailable to him/her?
e.g. A life threat will get a score of 10, threat to financial loss will get a score of 9, no discomfort but good to have will have a score of 1 or 2. To help one estimate the user’s trouble, one can do the followings:
- Analyze the user reviews available on Google, Playstore, forums etc. for their own platform and all the major competitors in the market
- Try to estimate the impact of the feature in measurable metrics like time saved, money saved etc.
Difficulty
Every feature is not the same when it comes to effort, feasibility, cost and end result. Development teams discover that certain features are a lot more difficult to develop than others.
It may require months or entirely new technology that may not be available or mammoth investment or hiring cost.
A careful analysis is required before embarking on development, to assess the feasibility of selecting a feature.
Taking into consideration all the above scores, the product team arrived at a net score for every feature with RFID using the formula below and prioritised the feature pipeline in the ascending order of the RFID score.
RFID = (R * F * I) / D
The RFID scores have simplified the decision making and logical thinking of the product team. But engraving the frameworks in stones is taking the framework towards the graveyard.
Hence, our product team keeps on iterating with the framework to keep it alive. The iterations need to be done along arriving at the most suitable Reach, Frequency, Importance and Difficulty score estimates.
Also, there are few special use cases for these scores:
Most demanded but most difficult features: Sometimes it is crucial to check the highest RFI scores such that they are given priority even if it is very difficult to develop.
For all features we also check the RFI scores and try to ensure the top RFI features are part of the final product, even if it takes a little extra effort to achieve them.
For example, a feature ‘Required Margin’ was added to the trading screen after assessing the RFI score, even if its RFID score was low.
The scores are graded on a scale of 1 to 10 with 10 as highest R, F, I and highest Difficulty.
For this feature R = 10, F = 10, I = 10, D = 7
RFID = Reach (10) x Frequency (10) x Importance (10) divided by Difficulty (7)
(10*10*10) / 7 = 143
RFI = Reach (10) x Frequency (10) x Importance (10) = 1000
For this feature, the RFI score was considered and the team decided to go ahead looking at the business importance despite a moderately high difficulty level.
- Sometimes to create a market differentiator which will be fruitful in the long run, we need to estimate the potential RFI score and not the current RFI score. These features are the long term bet for user acquisition.
To do a fair estimate of the potential of the RFI method is not a very simple process and we’ll discuss this in detail in our future blogs.
Till then please try the RFID method for your product prioritization and do let us know your findings.
How fast are you as a PM able to reach product market fit for your respective features/product? What have you all tried to make the process faster? Do share your success or failure stories around it.
Feel free to reach out for more discussion around this topic.
The content on this blog is for educational purposes only and should not be considered investment advice. While we strive for accuracy, some information may contain errors or delays in updates.
Mentions of stocks or investment products are solely for informational purposes and do not constitute recommendations. Investors should conduct their own research before making any decisions.
Investing in financial markets are subject to market risks, and past performance does not guarantee future results. It is advisable to consult a qualified financial professional, review official documents, and verify information independently before making investment decisions.