XIRR vs CAGR: Meaning, Difference, Calculation, Pros, Cons
XIRR vs CAGR: Meaning, Difference, Calculation, Pros, Cons
by Arun Bhat
Arun Bhat is a finance content writer at Rupeezy with over 8 months of experience in the finance industry. He holds an MBA degree in Finance from the RNS Institute of Technology. Arun is passionate about stock market research and brings in-depth expertise in stocks, futures and options, mutual funds, and ETFs.
Last Updated: 24 March, 20269 min read
00:00 / 00:00
Returns are the major factor investors will look into while investing and there are various methods one can utilize to evaluate the returns on their investments. XIRR and CAGR are two such methods that help you gauge the performance of your funds. In this article, we will explore what is XIRR and CAGR financial metrics and understand how they work, find out the differences between CAGR and XIRR, and understand when to use them.
XIRR, or Extended Internal Rate of Return, is a financial measure in the financial markets, used to calculate the annualized return for investments where there are irregular cashflows.
Unlike traditional methods, XIRR considers the varying amounts and dates of investments and withdrawals. This metric helps investors determine their return for a specific period irrespective of their irregular cashflows in the investment.
This metric is invaluable to portfolio investors since it helps them evaluate and differentiate the performance of individual stocks in their portfolios.
XIRR is especially useful in evaluating the performance of SIPs and investments having irregular cashflows because XIRR is calculated including all cash inflows and outflows, dividends, and capital gains
What is CAGR?
CAGR refers to the Compound Annual Growth Rate and is another financial measure expressing the average rate of growth of an investment over a given period under conditions of compounding per year.
Unlike absolute return, which shows the overall percentage gain or loss of an investment, CAGR shows annualized return over a specified period. It expresses the average annual return considering an initial investment, final value, and the duration that has lapsed.
CAGR is commonly used to compare the performance of the stock, mutual fund, or even the entire market over time. It is especially useful in long-term investments, as it eases out short-term variation and gives total clarity to the growth trend.
For instance, if an amount invested of Rs.50,000 five years back has now grown to Rs.85,000, then the CAGR would be 11.20%. This means your investment has grown at an average rate of 11% annually even though actual year-to-year had more fluctuations.
Difference Between XIRR and CAGR
Aspect
XIRR
CAGR
Definition
Evaluating the rate of returns taking into account irregular cashflows and dates
Determines the average annual growth rate presuming constant compounding
Time duration
It considers the timing of cashflows including every investment and withdrawal dates
It considers the start and end of the period.
Cashflow Handling
Accounts for varying amounts and dates of cash flows. For example, dividend and investment cash flows.
Assumes a single initial and final value, with no intermediate cash flows.
Complication
More complex as it would involve solving for the rate of return based on varying cash flows.
Simpler and can be calculated using just the initial value, final value, and the period for which the amount was invested.
Use
It is ideal for investments with irregular cash flows or for SIPs.
Best for simple investments with constant growth.
Accuracy
More accurate for investments with multiple cash flows.
Assumes steady growth, which may not reflect actual variations in returns.
XIRR and CAGR are financial metrics used to determine investment returns. However, both have their differences. Likewise, their results and the method of calculation are different. Let's look into the calculation of XIRR and CAGR with clear examples.
Calculation of XIRR
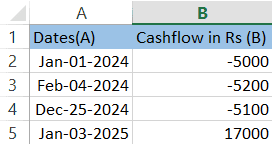
For instance, an investor has invested a total of Rs. 15,200 in mutual funds by investing different sums of amount in irregular intervals. Due to the good performance of the fund, the amount matures to Rs.17,000 resulting in a profit of Rs.1,800 to the investor. So Considering the irregular cashflows and intervals, Let us calculate the annualized returns of XIRR in Excel.
Step 1: Open Excel and Enter The Data
Open Excel and create a new worksheet
Enter the data in 2 columns. One for dates and another for the cashflows or the investment you make
Enter all the investments in negative value as it is a cash outflow for you. Similarly, all the withdrawals from the investments should entered in positive value as the cash is coming into your hands.
Note: The date format should be in mmm-dd-yyyy or mm-dd-yyyy
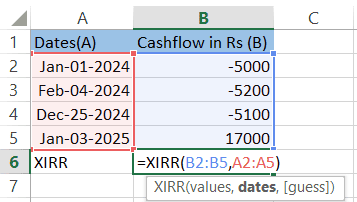
Figure showing the calculation of XIRRStep 2: Enter Formula for XIRR
In a blank cell Enter XIRR formula into the selected cell: = XIRR(B2:B5,A2:A5) and press Enter.
Note: B2:B5 is the cash outflow and inflow and A2:A5 is the range of dates where the inflows and outflows occur
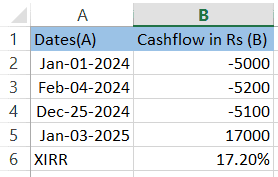
Figure showing the calculation of XIRRStep 3: Interpret the Result
After entering the formula, the cell will show the result of the XIRR annualized returns. For instance, if the result is 17.20%, the annualized return on your investment is 17.20%
Excel is one of the straightforward processes in calculating the XIRR annualized rate of returns with irregular cashflows and dates. By entering the cash flow and date information into Excel and using the XIRR formula, you can evaluate the performance of your investment.
Figure showing the calculation of XIRR using ExcelCalculation of CAGR
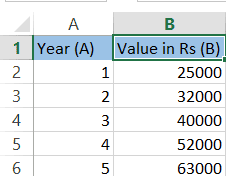
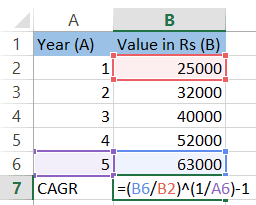
For instance, Gauthami has invested in a mutual fund of Rs.25,000, and over 5 years the investment has become Rs.63,000. Let's calculate the CAGR for Gauthami's investment.
Initial investment - Rs.25,000
Balance after 5 years - Rs.63,000
Investment tenure - 5 years
The CAGR equation uses three different values:
Beginning Balance is the amount of money you begin with.
The end Balance is the amount of money you’ll have after the period has passed.
Number of years is the total number of years between the initial value and the final value
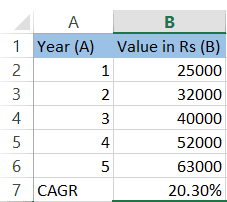
The CAGR of Gauthami’s investment will be approximately 20.30%
CAGR Calculation using Excel
Step 1: Open Excel and enter data
Open Excel and create a new worksheet
Enter data in 2 columns A and B. One represents the period of investment and the other column shows the investment value during each period.
Figure showing the calculation of CAGR in ExcelStep 2: Apply CAGR Formula
The formula for calculating CAGR in Excel is: =(End Value/Beginning Value) ^ (1/Number of Years) - 1
Here the end value is 63000 (in Cell B6)
The beginning value is 25000 (in Cell B2)
The number of years is 5 (in Cell A6)
Apply the formula by using the cells that have relevant data as shown in the figure below and hit enter. You can either use cells or directly input numerical values.
Figure showing the calculation of CAGR in ExcelStep 3: Interpret the results
After entering the formula in the selected cell, it will show the result of the CAGR annualized returns. For instance, if the CAGR return is 20.3% the 5-year annualized return of the investment is 20.30%.
Excel doesn’t have a specific formula to calculate CAGR. Therefore, you have to manually enter the data to calculate CAGR in Excel. Using Excel to determine CAGR is one of the efficient way to evaluate the performance of your Investment.
Figure showing the calculation of CAGR in ExcelXIRR vs CAGR: Pros and Cons
Particulars
XIRR
CAGR
Pros
Handles Irregular Cash Flows:
It is a tool to be used in cases when we have irregular cash flows.
Simplicity:
It is simple to understand and even calculate.
Realistic Return Calculation:
It gives a more realistic measure of return for investments in which cash flows occur periodically, like SIPs (Systematic Investment Plans).
Best Results for Lump Sum Investments:
It works best with an investment with only one initial cash outlay, without any incremental cash inflow or cash outflow,
Time value:
Reflects the time value of money more effectively than simple averages.
Comparison Across Investments:
It is used for comparing different investments over the same period, as it averages returns into a single annual growth rate.
Particulars
XIRR
CAGR
Cons
Complex Computation:
Computing the XIRR manually is more complex.
It usually requires a financial calculator or spreadsheet software.
Ignores Intermediate Cash Flows:
CAGR does not consider the flow of cash during the investment. lead to inaccurate conclusions when cashflows are irregular.
Timing of Cash Flow Is Very Crucial:
XIRR is very sensitive to the timing of cash flows. Even a slight change in the timing may result in a wide swing of changes in the Result.
Assumes Constant Growth:
CAGR assumes constant growth in the investment, Which may not reflect real-world volatility.
Less Intuitive:
For people who are unfamiliar with the finance background, sometimes the XIRR is less insightful compared to any other simple metric like CAGR.
Not suitable for all scenarios:
Since it does not consider the timing of cash flows, CAGR may not present an accurate picture of investments with frequent cash flows.
XIRR vs CAGR: When to Use?
XIRR is used in scenarios where the investment amount has irregular cashflows such as SIPs and mutual funds with frequent withdrawals and investments. It is also used in situations where the rate of return on the investment is not constant and varies over the period. Further, XIRR is helpful for investments that don’t have a fixed holding period.
CAGR is best used in situations where the rate of returns is stable and has a fixed holding period. It is very simple to calculate and understand and is best suited for situations where the investment doesn’t have irregular cash flows.
The choice between XIRR and CAGR would depend on the kind of investment one is making. XIRR would be the most appropriate when handling investments that remain irregular in their cash flows, such as the Systematic Investment Plan (SIP) or realty investment. This gives a more accurate representation of the return, taking into account the specific timing of each cash flow.
On the other hand, CAGR is best used for investments having a single, lump-sum investment. It will make the growth comparable only in an annualized way, and that is helpful when one wants to compare investments at a glance over the same period.
In the Rupeezy app, we present the CAGR to provide you with a clear picture of a stock's historical performance, allowing you to assess its past returns effectively. Once you invest in a mutual fund, whether through a lump sum or SIP, our app goes further by calculating and displaying the XIRR. This gives you a detailed view of the returns on each individual stock and your entire portfolio, taking into account all your deposits and withdrawals. This way, you can track the true growth of your investments with precision.
Conclusion
While both are key metrics for investment performance, XIRR and CAGR answer two different purposes: the former estimates the return on investment with irregular cash inflows at different dates, and the latter gives a more correct estimate of profitability.
While CAGR makes it very easy to compare investments with stable returns, the XIRR provides a detailed picture when one is dealing with an investment that has oscillating cash flows.
Rupeezy uses both of them to give you the full view of your portfolio performance and thus an informed investment decision. Whether it is diversified asset management or a long-term growth view, Rupeezy tools ensure you get the insight to succeed.
The content on this blog is for educational purposes only and should not be considered investment advice. While we strive for accuracy, some information may contain errors or delays in updates.
Mentions of stocks or investment products are solely for informational purposes and do not constitute recommendations. Investors should conduct their own research before making any decisions.
Investing in financial markets are subject to market risks, and past performance does not guarantee future results. It is advisable to consult a qualified financial professional, review official documents, and verify information independently before making investment decisions.
Want to invest In Mutual Fund?
Open Rupeezy account now. It is free and 100% secure.