What is the Smart Explore Feature on Rupeezy? Latest Update
What is the Smart Explore Feature on Rupeezy? Latest Update
by Aron Vaxen
Aron Vaxen is a Content Manager at Rupeezy with over 6 years of experience in the finance industry. He holds a B.Com degree from Canara College. Aron is passionate about stock market research and brings in-depth expertise in stocks, futures and options, mutual funds, ETFs, and personal finance. He specializes in creating actionable content that simplifies complex financial concepts for a diverse audience.
Last Updated: 26 November, 20247 min read
00:00 / 00:00
Risk and return are the two important faces of the same coin. When it comes to investing, understanding the risk-return tradeoff plays a very important role in making well-thought-out decisions. But how does one analyse the risk-return tradeoff when it comes to mutual funds, and wouldn’t it be better if we could understand this relationship visually instead of spending hours crunching numbers? This is where the Smart Explore feature on Rupeezy comes in handy! Let’s understand what the Smart Explore feature is and get a better understanding of how you can use this while analysing mutual funds. Keep reading to find out.
What is the Smart Explore Feature of Rupeezy? Smart
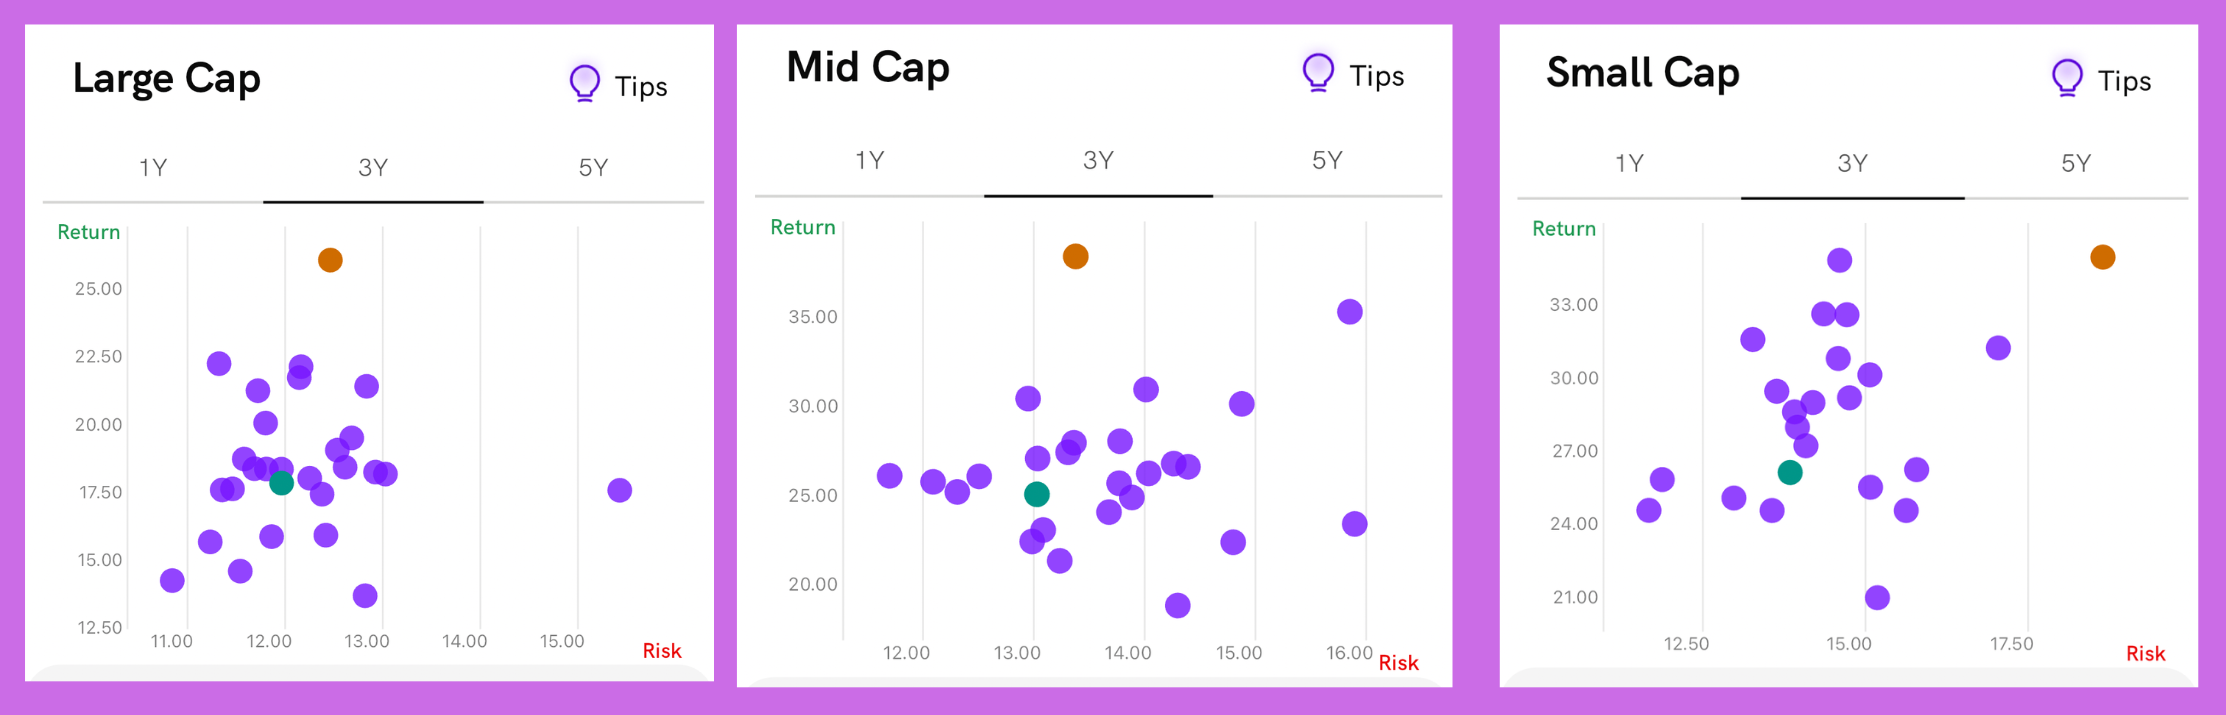
The Smart Explore is a great way to visually look at the returns and risks involved in investing in mutual funds. This gives us a clearer understanding of the relationship between the risk and return of investing in a mutual fund. The smart explore feature uses graphs to give a visual representation of the relationship between risk and returns. The y-axis plots the returns and the corresponding risks involved are plotted on the x-axis. Risks are usually plotted as measures of their standard deviation or volatility. Each data point on the graph represents a mutual fund.
When it comes to investing, returns refer to the profit that you earn by investing. Risk on the other hand refers to the chances of losing your investment or making negative returns. A general rule of thumb in investing is higher the risk the more the returns and the lower the risk the lower the returns. It is very rare to find investments that do not adhere to these rules.
What are the uses of the Smart Explore Feature on Rupeezy?
The primary uses of the Smart Explore feature are as follows:
1. Investment Comparison
The risk-return graph allows investors to understand and compare different mutual fund options with reference to their returns and the risks involved. As discussed above, higher returns tend to run together with higher risks. The Smart Explore feature helps users make educated decisions and get a better understanding by using it to compare the different options available. The graphical representation that the Smart Explore feature uses goes a long way in making it easier to identify the trade-offs that one is willing to make between risks and returns.
2. Ease of Selecting Mutual Funds
The Smart Explore feature along with the risk-return graph is made available for every mutual fund category, for eg. large, mid and small-cap. Each of these allows you to compare more than 40 mutual funds.
3. Risk Assessment
While investing in mutual funds, risks are inevitable. The Smart Explore graph aids investors in making decisions by visually identifying the risks, they can then analyse and adjust their investment strategies accordingly.
How to analyse the graphs produced by the Smart Explore feature?
When you access the Smart Explore feature you will be first given the option to select the category of the mutual fund. The categories included here are Large Cap, Mid Cap, Small Cap, ELSS, Index Funds, Sectoral, Multi-Cap etc. Once you choose the categories, Smart Explore works its magic and plots the risk-return relationship on a graph for all the funds belonging to the 40 Asset Management Companies. The purple dots here represent the different mutual funds whereas the green dot represents the category average.
Smart
Smart Explore Feature on Rupeezy
For ease of explanation, we will divide the graph into four quadrants:
Upper right quadrant: This quadrant holds the mutual funds that generate higher returns, but are also associated with higher risk. The funds are usually suitable for high-risk takers.
Upper left quadrant: This quadrant holds the mutual funds that generate a good amount of returns, with relatively lesser risks involved. These are ideal mutual funds that investors should invest in. They tend to have the highest Sharpe Ratio or risk-adjusted returns.
Lower left quadrant: This quadrant holds mutual funds that involve very less risk, but generate low returns. These mutual funds are best for investors who are risk-averse and do not like to invest in risky mutual funds.
Lower right quadrant: This quadrant holds mutual funds that are unable to generate good returns even after taking significant risks. These funds have the lowest Sharpe Ratio. It is advised that investors stay away from such funds.
Here’s a pro tip, an ideal fund here would fall above the green dot and at the same time would fall to its left. This would signify that the fund offers returns above the category average (above the green dot) and at the same time has lesser risk in comparison to the category average (to the left of the green dot).
How is the Smart Explore feature useful for different types of investors?
To understand this better let’s take a look at how a risk-taker and a rational investor can make use of this feature.
1. Risk-Seeking Investors
These investors have a high-risk appetite and can handle asset volatility. They usually prefer the funds in the upper right quadrant, where the mutual funds have higher returns, but also come with higher risks.
2. Rational investors
These investors are comfortable investing in high-risk mutual funds, provided they are compensated accordingly. For instance, if the returns on investing in a high-risk fund and a low-risk fund were similar, a rational investor may decide to ditch the former and continue investing in the latter.
Breaking it Down for Math Nerds!
The risk of a mutual fund is calculated using the standard deviation of calendar month returns which is then annualised. Let’s understand this better with the help of an example of a Mutual fund that has a 3-year CAGR of 25% and 3-year Annualised Risk of 15%.
The probability of returns deviating by 1 standard deviation is 68% i.e there is 68% chance that your returns in the next year will be between ( 25 – 15% to 25 + 15%) or between 10% to 40%
The probability of returns deviating by a standard deviation of 2 is 95% i.e there is 95% chance that your returns in the next year will be between ( 25 – (2 x 15%) to 25 + (2 x 15%)) or between -5% to 55%
The probability of returns deviating by a standard deviation of 3 is 99.7% i.e there is 99.7% chance that your returns in the next year will be between ( 25 – (3 x 15%) to 25 +(3 x 15%)) or between -20% to 70%.
In Closing
Investing only based on returns and without understanding the risks associated with the investments can prove to be harmful. This makes the Smart Explore feature a game changer for investors who have simply been identifying mutual funds based on past returns. The graphs that represent the relationship between risk and return offer valuable insights into investment opportunities and portfolio construction for investors and financial professionals. Users can visualize the relationship between the returns of their investments and the risks involved, thus enabling investors to manage their portfolios efficiently.
You can also up your investment game by downloading the Rupeezy app today and making use of the Smart Explore feature, the best app for mutual fund investments. The app also comes with other investment tools that are bound to improve your investment analysis like the Impact Analysis and MF Lab. Happy Investing!
The content on this blog is for educational purposes only and should not be considered investment advice. While we strive for accuracy, some information may contain errors or delays in updates.
Mentions of stocks or investment products are solely for informational purposes and do not constitute recommendations. Investors should conduct their own research before making any decisions.
Investing in financial markets are subject to market risks, and past performance does not guarantee future results. It is advisable to consult a qualified financial professional, review official documents, and verify information independently before making investment decisions.
Want to invest In Mutual Fund?
Open Rupeezy account now. It is free and 100% secure.